Bank of America 2006 Annual Report Download - page 42
Download and view the complete annual report
Please find page 42 of the 2006 Bank of America annual report below. You can navigate through the pages in the report by either clicking on the pages listed below, or by using the keyword search tool below to find specific information within the annual report.-
 1
1 -
2
-
3
-
4
-
5
-
6
-
7
-
8
-
9
-
10
-
11
-
12
-
13
-
14
-
15
-
16
-
17
-
18
-
19
-
20
-
21
-
22
-
23
-
24
-
25
-
26
-
27
-
28
-
29
-
30
-
31
-
 32
32 -
 33
33 -
 34
34 -
 35
35 -
 36
36 -
 37
37 -
 38
38 -
 39
39 -
 40
40 -
 41
41 -
 42
42 -
 43
43 -
 44
44 -
 45
45 -
 46
46 -
 47
47 -
 48
48 -
 49
49 -
 50
50 -
 51
51 -
 52
52 -
53
-
54
-
55
-
56
-
57
-
58
-
59
-
60
-
61
-
62
-
63
-
64
-
65
-
66
-
67
-
68
-
69
-
70
-
71
-
72
-
73
-
74
-
75
-
76
-
77
-
78
-
79
-
80
-
81
-
82
-
83
-
84
-
85
-
86
-
87
-
88
-
89
-
90
-
91
-
92
-
93
-
94
-
95
-
96
-
97
-
98
-
99
-
100
-
101
-
102
-
103
-
104
-
105
-
106
-
107
-
108
-
109
-
110
-
111
-
112
-
113
-
114
-
115
-
116
-
117
-
118
-
119
-
120
-
121
-
122
-
123
-
124
-
125
-
126
-
127
-
128
-
129
-
130
-
131
-
132
-
133
-
134
-
135
-
136
-
137
-
138
-
139
-
140
-
141
-
142
-
143
-
144
-
145
-
146
-
147
-
148
-
149
-
150
-
151
-
152
-
153
-
154
-
155
 |
 |

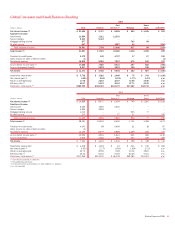
Table 5 Five Year Summary of Selected Financial Data
(Dollars in millions, except per share information) 2006 2005 2004 2003 2002
Income statement
Net interest income
$ 34,591
$ 30,737 $ 27,960 $ 20,505 $ 20,117
Noninterest income
38,432
25,354 21,005 17,329 14,874
Total revenue
73,023
56,091 48,965 37,834 34,991
Provision for credit losses
5,010
4,014 2,769 2,839 3,697
Gains (losses) on sales of debt securities
(443)
1,084 1,724 941 630
Noninterest expense
35,597
28,681 27,012 20,155 18,445
Income before income taxes
31,973
24,480 20,908 15,781 13,479
Income tax expense
10,840
8,015 6,961 5,019 3,926
Net income
21,133
16,465 13,947 10,762 9,553
Average common shares issued and outstanding (in thousands)
4,526,637
4,008,688 3,758,507 2,973,407 3,040,085
Average diluted common shares issued and outstanding
(in thousands)
4,595,896
4,068,140 3,823,943 3,030,356 3,130,935
Performance ratios
Return on average assets
1.44%
1.30% 1.34% 1.44% 1.46%
Return on average common shareholders’ equity
16.27
16.51 16.47 21.50 19.96
Total ending equity to total ending assets
9.27
7.86 9.03 6.76 7.92
Total average equity to total average assets
8.90
7.86 8.12 6.69 7.33
Dividend payout
45.66
46.61 46.31 39.76 38.79
Per common share data
Earnings
$ 4.66
$ 4.10 $ 3.71 $ 3.62 $ 3.14
Diluted earnings
4.59
4.04 3.64 3.55 3.05
Dividends paid
2.12
1.90 1.70 1.44 1.22
Book value
29.70
25.32 24.70 16.86 17.04
Average balance sheet
Total loans and leases
$ 652,417
$ 537,218 $ 472,617 $ 356,220 $ 336,820
Total assets
1,466,681
1,269,892 1,044,631 749,104 653,732
Total deposits
672,995
632,432 551,559 406,233 371,479
Long-term debt
130,124
97,709 92,303 67,077 65,550
Common shareholders’ equity
129,773
99,590 84,584 50,035 47,837
Total shareholders’ equity
130,463
99,861 84,815 50,091 47,898
Asset quality
Allowance for credit losses
$ 9,413
$ 8,440 $ 9,028 $ 6,579 $ 6,851
Nonperforming assets
1,856
1,603 2,455 3,021 5,262
Allowance for loan and lease losses as a percentage of total loans and
leases outstanding
1.28%
1.40% 1.65% 1.66% 1.85%
Allowance for loan and lease losses as a percentage of total nonperforming
loans and leases
505
532 390 215 126
Net charge-offs
$ 4,539
$ 4,562 $ 3,113 $ 3,106 $ 3,697
Net charge-offs as a percentage of average loans and leases
0.70%
0.85% 0.66% 0.87% 1.10%
Nonperforming loans and leases as a percentage of total loans and
leases outstanding
0.25
0.26 0.42 0.77 1.47
Nonperforming assets as a percentage of total loans, leases, and foreclosed
properties
0.26
0.28 0.47 0.81 1.53
Ratio of the allowance for loan and lease losses at December 31 to net
charge-offs
1.99
1.76 2.77 1.98 1.72
Capital ratios (period end)
Risk-based capital:
Tier 1
8.64%
8.25% 8.20% 8.02% 8.41%
Total
11.88
11.08 11.73 12.05 12.63
Tier 1 Leverage
6.36
5.91 5.89 5.86 6.44
Market capitalization
$ 238,021
$ 184,586 $ 190,147 $ 115,926 $ 104,418
Market price per share of common stock
Closing
$ 53.39
$ 46.15 $ 46.99 $ 40.22 $ 34.79
High closing
54.90
47.08 47.44 41.77 38.45
Low closing
43.09
41.57 38.96 32.82 27.08
40
Bank of America 2006