Bank of America 2006 Annual Report Download - page 124
Download and view the complete annual report
Please find page 124 of the 2006 Bank of America annual report below. You can navigate through the pages in the report by either clicking on the pages listed below, or by using the keyword search tool below to find specific information within the annual report.-
 1
1 -
2
-
3
-
4
-
5
-
6
-
7
-
8
-
9
-
10
-
11
-
12
-
13
-
14
-
15
-
16
-
17
-
18
-
19
-
20
-
21
-
22
-
23
-
24
-
25
-
26
-
27
-
28
-
29
-
30
-
31
-
32
-
33
-
34
-
35
-
36
-
37
-
38
-
39
-
40
-
41
-
42
-
43
-
44
-
45
-
46
-
47
-
48
-
49
-
50
-
51
-
52
-
53
-
54
-
55
-
56
-
57
-
58
-
59
-
60
-
61
-
62
-
63
-
64
-
65
-
66
-
67
-
68
-
69
-
70
-
71
-
72
-
73
-
74
-
75
-
76
-
77
-
78
-
79
-
80
-
81
-
82
-
83
-
84
-
85
-
86
-
87
-
88
-
89
-
90
-
91
-
92
-
93
-
94
-
95
-
96
-
97
-
98
-
99
-
100
-
101
-
102
-
103
-
104
-
105
-
106
-
107
-
108
-
109
-
110
-
111
-
112
-
113
-
 114
114 -
 115
115 -
 116
116 -
 117
117 -
 118
118 -
 119
119 -
 120
120 -
 121
121 -
 122
122 -
 123
123 -
 124
124 -
 125
125 -
 126
126 -
 127
127 -
 128
128 -
 129
129 -
 130
130 -
 131
131 -
 132
132 -
 133
133 -
 134
134 -
135
-
136
-
137
-
138
-
139
-
140
-
141
-
142
-
143
-
144
-
145
-
146
-
147
-
148
-
149
-
150
-
151
-
152
-
153
-
154
-
155
 |
 |

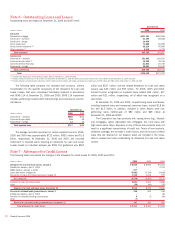
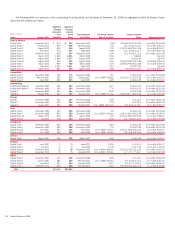
December 31, 2006 December 31, 2005
(1)
(Dollars in millions)
Total Loans
and Leases
Accruing
Loans and
Leases Past
Due 90 Days
or More
Nonperforming
Loans and Leases
Total Loans
and Leases
Accruing
Loans and
Leases Past
Due 90 Days
or More
Nonperforming
Loans and Leases
Residential mortgage
(2)
$ 245,840 $ 118 $ 660
$188,380 $ – $ 570
Credit card – domestic
142,599 3,828 n/a
60,785 1,217 n/a
Credit card – foreign
27,890 608 n/a
– – n/a
Home equity lines
75,197 – 251
62,546 3 117
Direct/Indirect consumer
75,112 493 44
49,544 75 37
Other consumer
9,218 38 77
6,725 15 61
Total consumer
575,856 5,085 1,032
367,980 1,310 785
Commercial – domestic
163,274 265 598
142,447 117 581
Commercial real estate
36,258 78 118
35,766 4 49
Commercial lease financing
21,864 26 42
20,705 15 62
Commercial – foreign
20,681 9 13
21,330 32 34
Total commercial
242,077 378 771
220,248 168 726
Total managed loans and leases
817,933 5,463 1,803
588,228 1,478 1,511
Managed loans in securitizations
(111,443) (2,407) (16)
(14,437) (23) –
Total held loans and leases
$ 706,490 $ 3,056 $1,787
$573,791 $1,455 $1,511
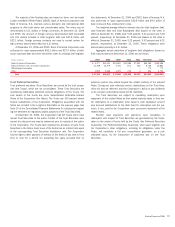
Year Ended December 31, 2006 Year Ended December 31, 2005
(1)
(Dollars in millions)
Average Loans
and Leases
Outstanding
Net
Losses
Net Loss
Ratio (3)
Average Loans
and Leases
Outstanding
Net
Losses
Net Loss
Ratio
(3)
Residential mortgage
$213,097
$39 0.02% $179,474 $ 27 0.02%
Credit card – domestic
138,592
5,395 3.89 59,048 4,086 6.92
Credit card – foreign
24,817
980 3.95 –––
Home equity lines
69,071
51 0.07 56,821 31 0.05
Direct/Indirect consumer
68,227
839 1.23 46,719 248 0.53
Other consumer
10,713
303 2.83 6,908 275 3.99
Total consumer
524,517
7,607 1.45 348,970 4,667 1.34
Commercial – domestic
153,796
367 0.24 130,882 170 0.13
Commercial real estate
36,939
3 0.01 34,304 – –
Commercial lease financing
20,862
(28) (0.14) 20,441 231 1.13
Commercial – foreign
23,521
(8) (0.04) 18,491 (72) (0.39)
Total commercial
235,118
334 0.14 204,118 329 0.16
Total managed loans and leases
759,635
7,941 1.05 553,088 4,996 0.90
Managed loans in securitizations
(107,218)
(3,402) 3.17 (15,870) (434) 2.73
Total held loans and leases
$652,417
$4,539 0.70% $537,218 $4,562 0.85%
(1) The amounts at and for the year ended December 31, 2005 have been adjusted to include certain mortgage and auto securitizations as these are now included in the Corporation’s definition of managed loans and leases.
(2) Accruing loans and leases past due 90 days or more represent residential mortgage loans related to repurchases pursuant to our servicing agreements with Government National Mortgage Association mortgage pools whose
repayments are insured by the Federal Housing Administration or guaranteed by the Department of Veterans Affairs. In 2005, these loans were recorded in loans held-for-sale and amounted to $161 million.
(3) The net loss ratio is calculated by dividing managed loans and leases net losses by average managed loans and leases outstanding for each loan and lease category.
n/a = not applicable
Variable Interest Entities
At December 31, 2006 and 2005, the assets and liabilities of the Corpo-
ration’s multi-seller asset-backed commercial paper conduits that have
been consolidated in accordance with FIN 46R were reflected in AFS Secu-
rities, Other Assets, and Commercial Paper and Other Short-term Borrow-
ings. As of December 31, 2006 and 2005, the Corporation held $10.5
billion and $6.6 billion of assets in these entities, and in the unlikely
event that all of the assets in the VIEs become worthless, the Corpo-
ration’s maximum loss exposure associated with these entities including
unfunded lending commitments would be approximately $12.9 billion and
$8.3 billion. In addition, the Corporation had net investments in leveraged
lease trusts totaling $8.6 billion and $8.2 billion at December 31, 2006
and 2005. These amounts, which were reflected in Loans and Leases,
represent the Corporation’s maximum loss exposure to these entities in
the unlikely event that the leveraged lease investments become worthless.
Debt issued by the leveraged lease trusts is nonrecourse to the Corpo-
ration. The Corporation also had contractual relationships with other con-
solidated VIEs that engage in leasing or lending activities or real estate
joint ventures. As of December 31, 2006 and 2005, the amount of assets
of these entities was $3.3 billion and $750 million, and in the unlikely
event that all of the assets in the VIEs become worthless, the Corpo-
ration’s maximum possible loss exposure would be $1.6 billion and $212
million.
122
Bank of America 2006