Bank of America 2006 Annual Report Download - page 141
Download and view the complete annual report
Please find page 141 of the 2006 Bank of America annual report below. You can navigate through the pages in the report by either clicking on the pages listed below, or by using the keyword search tool below to find specific information within the annual report.-
 1
1 -
2
-
3
-
4
-
5
-
6
-
7
-
8
-
9
-
10
-
11
-
12
-
13
-
14
-
15
-
16
-
17
-
18
-
19
-
20
-
21
-
22
-
23
-
24
-
25
-
26
-
27
-
28
-
29
-
30
-
31
-
32
-
33
-
34
-
35
-
36
-
37
-
38
-
39
-
40
-
41
-
42
-
43
-
44
-
45
-
46
-
47
-
48
-
49
-
50
-
51
-
52
-
53
-
54
-
55
-
56
-
57
-
58
-
59
-
60
-
61
-
62
-
63
-
64
-
65
-
66
-
67
-
68
-
69
-
70
-
71
-
72
-
73
-
74
-
75
-
76
-
77
-
78
-
79
-
80
-
81
-
82
-
83
-
84
-
85
-
86
-
87
-
88
-
89
-
90
-
91
-
92
-
93
-
94
-
95
-
96
-
97
-
98
-
99
-
100
-
101
-
102
-
103
-
104
-
105
-
106
-
107
-
108
-
109
-
110
-
111
-
112
-
113
-
114
-
115
-
116
-
117
-
118
-
119
-
120
-
121
-
122
-
123
-
124
-
125
-
126
-
127
-
128
-
129
-
130
-
 131
131 -
 132
132 -
 133
133 -
 134
134 -
 135
135 -
 136
136 -
 137
137 -
 138
138 -
 139
139 -
 140
140 -
 141
141 -
 142
142 -
 143
143 -
 144
144 -
 145
145 -
 146
146 -
 147
147 -
 148
148 -
 149
149 -
 150
150 -
 151
151 -
152
-
153
-
154
-
155
 |
 |

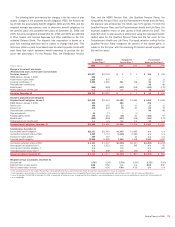
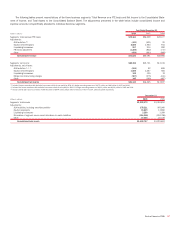
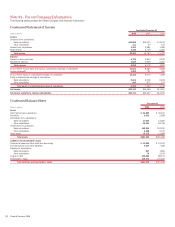
The following table summarizes the changes in the fair value of plan
assets, changes in the projected benefit obligation (PBO), the funded sta-
tus of both the accumulated benefit obligation (ABO) and the PBO, and the
weighted average assumptions used to determine benefit obligations for
the pension plans and postretirement plans at December 31, 2006 and
2005. Amounts recognized at December 31, 2006 and 2005 are reflected
in Other Assets, and Accrued Expenses and Other Liabilities on the Con-
solidated Balance Sheet. The discount rate assumption is based on a
cash flow matching technique and is subject to change each year. This
technique utilizes a yield curve based upon Aa rated corporate bonds with
cash flows that match estimated benefit payments to produce the dis-
count rate assumption. For the Pension Plan, the FleetBoston Pension
Plan, and the MBNA Pension Plan, (the Qualified Pension Plans), the
Nonqualified Pension Plans, and the Postretirement Health and Life Plans,
the discount rate at December 31, 2006, was 5.75 percent. For both the
Qualified Pension Plans and the Postretirement Health and Life Plans, the
expected long-term return on plan assets is 8.00 percent for 2007. The
expected return on plan assets is determined using the calculated market-
related value for the Qualified Pension Plans and the fair value for the
Postretirement Health and Life Plans. The asset valuation method for the
Qualified Pension Plans recognizes 60 percent of the market gains or
losses in the first year, with the remaining 40 percent spread equally over
the next four years.
Qualified
Pension Plans
(1)
Nonqualified
Pension Plans
(1)
Postretirement
Health and Life Plans
(1)
(Dollars in millions) 2006 2005 2006 2005 2006 2005
Change in fair value of plan assets
(Primarily listed stocks, fixed income and real estate)
Fair value, January 1
$13,097
$12,153
$1
$1
$ 126
$ 166
MBNA balance, January 1, 2006
555
–
–
–
–
–
Actual return on plan assets
1,829
803
–
–
15
11
Company contributions
(2)
2,200
1,000
321
118
52
27
Plan participant contributions
–
–
–
–
98
98
Benefits paid
(888)
(859)
(322)
(118)
(213)
(176)
Federal subsidy on benefits paid
n/a
n/a
n/a
n/a
12
n/a
Fair value, December 31
$16,793
$13,097 $– $1 $90 $ 126
Change in projected benefit obligation
Projected benefit obligation, January 1
$11,690
$11,461
$ 1,108
$ 1,094
$ 1,420
$ 1,352
MBNA balance, January 1, 2006
695
–
486
–
278
–
Service cost
306
261
13
11
13
11
Interest cost
676
643
78
61
86
78
Plan participant contributions
–
–
–
–
98
98
Plan amendments
33
(77)
–
(1)
–
–
Actuarial (gains) losses
168
261
(18)
61
(145)
57
Benefits paid
(888)
(859)
(322)
(118)
(213)
(176)
Federal subsidy on benefits paid
n/a
n/a
n/a
n/a
12
n/a
Projected benefit obligation, December 31
$12,680
$11,690
$ 1,345
$ 1,108
$ 1,549
$ 1,420
Funded status, December 31
Accumulated benefit obligation
$12,151
$11,383
$ 1,345
$ 1,085
n/a
n/a
Overfunded (unfunded) status of ABO
4,642
1,714
(1,345)
(1,084)
n/a
n/a
Provision for future salaries
529
307
–
23
n/a
n/a
Projected benefit obligation
12,680
11,690
1,345
1,108
1,549
1,420
Overfunded (unfunded) status of PBO
$ 4,113
$ 1,407
$(1,345)
$(1,107)
$(1,459)
$(1,294)
Unrecognized net actuarial loss
(3)
n/a
2,621
n/a
262
n/a
92
Unrecognized transition obligation
(3)
n/a
–
n/a
–
n/a
221
Unrecognized prior service cost
(3)
n/a
209
n/a
(52)
n/a
–
Amount recognized, December 31
$ 4,113
$ 4,237
$(1,345)
$ (897)
$(1,459)
$ (981)
Weighted average assumptions, December 31
Discount rate
5.75%
5.50%
5.75%
5.50%
5.75%
5.50%
Expected return on plan assets
8.00
8.50
n/a
n/a
8.00
8.50
Rate of compensation increase
4.00
4.00
4.00
4.00
n/a
n/a
(1) The measurement date for the Qualified Pension Plans, Nonqualified Pension Plans, and Postretirement Health and Life Plans was December 31 of each year reported.
(2) The Corporation’s best estimate of its contributions to be made to the Qualified Pension Plans, Nonqualified Pension Plans, and Postretirement Health and Life Plans in 2007 is $0, $97 million and $95 million.
(3) Upon the adoption of SFAS 158 on December 31, 2006, unrecognized net actuarial losses, unrecognized transition obligations, and unrecognized prior service costs are now recorded as an adjustment to Accumulated OCI.
n/a = not applicable
Bank of America 2006
139