Bank of America 2006 Annual Report Download - page 118
Download and view the complete annual report
Please find page 118 of the 2006 Bank of America annual report below. You can navigate through the pages in the report by either clicking on the pages listed below, or by using the keyword search tool below to find specific information within the annual report.-
 1
1 -
2
-
3
-
4
-
5
-
6
-
7
-
8
-
9
-
10
-
11
-
12
-
13
-
14
-
15
-
16
-
17
-
18
-
19
-
20
-
21
-
22
-
23
-
24
-
25
-
26
-
27
-
28
-
29
-
30
-
31
-
32
-
33
-
34
-
35
-
36
-
37
-
38
-
39
-
40
-
41
-
42
-
43
-
44
-
45
-
46
-
47
-
48
-
49
-
50
-
51
-
52
-
53
-
54
-
55
-
56
-
57
-
58
-
59
-
60
-
61
-
62
-
63
-
64
-
65
-
66
-
67
-
68
-
69
-
70
-
71
-
72
-
73
-
74
-
75
-
76
-
77
-
78
-
79
-
80
-
81
-
82
-
83
-
84
-
85
-
86
-
87
-
88
-
89
-
90
-
91
-
92
-
93
-
94
-
95
-
96
-
97
-
98
-
99
-
100
-
101
-
102
-
103
-
104
-
105
-
106
-
107
-
 108
108 -
 109
109 -
 110
110 -
 111
111 -
 112
112 -
 113
113 -
 114
114 -
 115
115 -
 116
116 -
 117
117 -
 118
118 -
 119
119 -
 120
120 -
 121
121 -
 122
122 -
 123
123 -
 124
124 -
 125
125 -
 126
126 -
 127
127 -
 128
128 -
129
-
130
-
131
-
132
-
133
-
134
-
135
-
136
-
137
-
138
-
139
-
140
-
141
-
142
-
143
-
144
-
145
-
146
-
147
-
148
-
149
-
150
-
151
-
152
-
153
-
154
-
155
 |
 |

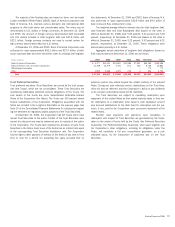
The following table presents the current fair value and the associated
gross unrealized losses only on investments in securities with gross unre-
alized losses at December 31, 2006 and 2005. The table also discloses
whether these securities have had gross unrealized losses for less than
twelve months, or for twelve months or longer.
December 31, 2006
Less than twelve months Twelve months or longer Total
(Dollars in millions) Fair Value
Gross
Unrealized
Losses Fair Value
Gross
Unrealized
Losses Fair Value
Gross
Unrealized
Losses
Available-for-sale securities
U.S. Treasury securities and agency debentures
$ 387 $ (9) $ – $ – $ 387 $ (9)
Mortgage-backed securities
4,684 (128) 151,092 (4,676) 155,776 (4,804)
Foreign securities
45 (1) 6,908 (77) 6,953 (78)
Other taxable securities
5,452 (125) 287 (9) 5,739 (134)
Total taxable securities
10,568 (263) 158,287 (4,762) 168,855 (5,025)
Tax-exempt securities
811 (4) 1,271 (30) 2,082 (34)
Total temporarily-impaired available-for-sale debt securities
11,379 (267) 159,558 (4,792) 170,937 (5,059)
Temporarily-impaired marketable equity securities
244 (10) – – 244 (10)
Total temporarily-impaired securities
$11,623 $(277) $159,558 $(4,792) $171,181 $(5,069)
December 31, 2005
Less than twelve months Twelve months or longer Total
(Dollars in millions) Fair Value
Gross
Unrealized
Losses Fair Value
Gross
Unrealized
Losses Fair Value
Gross
Unrealized
Losses
Available-for-sale securities
U.S. Treasury securities and agency debentures
$ 251
$ (9) $ 163 $ (4) $ 414 $ (13)
Mortgage-backed securities
149,979
(3,766) 40,236 (1,502) 190,215 (5,268)
Foreign securities
3,455
(41) 852 (13) 4,307 (54)
Other taxable securities
3,882
(79) 469 (20) 4,351 (99)
Total taxable securities
157,567
(3,895) 41,720 (1,539) 199,287 (5,434)
Tax-exempt securities
2,308
(27) 156 (5) 2,464 (32)
Total temporarily-impaired available-for-sale debt securities
159,875
(3,922) 41,876 (1,544) 201,751 (5,466)
Temporarily-impaired marketable equity securities
146
(18) – – 146 (18)
Total temporarily-impaired securities
$160,021
$(3,940) $41,876 $(1,544) $201,897 $(5,484)
Management evaluates securities for other-than-temporary impair-
ment on a quarterly basis, and more frequently when conditions warrant
such evaluation. Factors considered in determining whether an impairment
is other-than-temporary include (1) the length of time and the extent to
which the fair value has been less than cost, (2) the financial condition
and near-term prospects of the issuer, and (3) the intent and ability of the
Corporation to hold the investment for a period of time sufficient to allow
for any anticipated recovery in fair value.
At December 31, 2006, the amortized cost of approximately 5,000
securities in AFS securities exceeded their fair value by $5.1 billion.
Included in the $5.1 billion of gross unrealized losses on AFS securities at
December 31, 2006, was $277 million of gross unrealized losses that
have existed for less than twelve months and $4.8 billion of gross unreal-
ized losses that have existed for a period of twelve months or longer. Of
the gross unrealized losses existing for twelve months or more, $4.7 bil-
lion, or 98 percent, of the gross unrealized loss is related to approximately
1,500 mortgage-backed securities. These securities are predominately all
investment grade, with more than 90 percent rated AAA. The gross unreal-
ized losses on these mortgage-backed securities are due to overall
increases in market interest rates. The Corporation has the ability and
intent to hold these securities for a period of time sufficient to recover all
gross unrealized losses. Accordingly, the Corporation has not recognized
any other-than-temporary impairment for these securities.
The Corporation had investments in securities from the Federal
National Mortgage Association (Fannie Mae) and Federal Home Loan
Mortgage Corporation (Freddie Mac) that exceeded 10 percent of con-
solidated Shareholders’ Equity as of December 31, 2006 and 2005.
Those investments had market values of $109.9 billion and $42.0 billion
at December 31, 2006, and $144.1 billion and $46.9 billion at
December 31, 2005. In addition, these investments had total amortized
costs of $113.5 billion and $43.3 billion at December 31, 2006, and
$148.0 billion and $48.3 billion at December 31, 2005. As disclosed in
the preceding paragraph, the Corporation has not recognized any other-
than-temporary impairment for these securities.
Securities are pledged or assigned to secure borrowed funds, govern-
ment and trust deposits and for other purposes. The carrying value of
pledged securities was $83.8 billion and $116.7 billion at December 31,
2006 and 2005.
116
Bank of America 2006