Bank of America 2006 Annual Report Download - page 137
Download and view the complete annual report
Please find page 137 of the 2006 Bank of America annual report below. You can navigate through the pages in the report by either clicking on the pages listed below, or by using the keyword search tool below to find specific information within the annual report.-
 1
1 -
2
-
3
-
4
-
5
-
6
-
7
-
8
-
9
-
10
-
11
-
12
-
13
-
14
-
15
-
16
-
17
-
18
-
19
-
20
-
21
-
22
-
23
-
24
-
25
-
26
-
27
-
28
-
29
-
30
-
31
-
32
-
33
-
34
-
35
-
36
-
37
-
38
-
39
-
40
-
41
-
42
-
43
-
44
-
45
-
46
-
47
-
48
-
49
-
50
-
51
-
52
-
53
-
54
-
55
-
56
-
57
-
58
-
59
-
60
-
61
-
62
-
63
-
64
-
65
-
66
-
67
-
68
-
69
-
70
-
71
-
72
-
73
-
74
-
75
-
76
-
77
-
78
-
79
-
80
-
81
-
82
-
83
-
84
-
85
-
86
-
87
-
88
-
89
-
90
-
91
-
92
-
93
-
94
-
95
-
96
-
97
-
98
-
99
-
100
-
101
-
102
-
103
-
104
-
105
-
106
-
107
-
108
-
109
-
110
-
111
-
112
-
113
-
114
-
115
-
116
-
117
-
118
-
119
-
120
-
121
-
122
-
123
-
124
-
125
-
126
-
 127
127 -
 128
128 -
 129
129 -
 130
130 -
 131
131 -
 132
132 -
 133
133 -
 134
134 -
 135
135 -
 136
136 -
 137
137 -
 138
138 -
 139
139 -
 140
140 -
 141
141 -
 142
142 -
 143
143 -
 144
144 -
 145
145 -
 146
146 -
 147
147 -
148
-
149
-
150
-
151
-
152
-
153
-
154
-
155
 |
 |

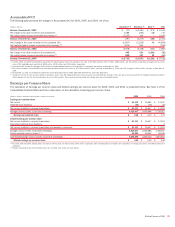
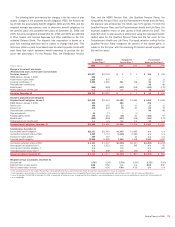
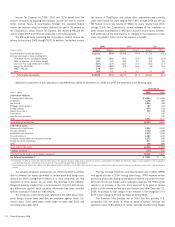
Accumulated OCI
The following table presents the changes in Accumulated OCI for 2006, 2005, and 2004, net of tax.
(Dollars in millions) Securities
(1,2)
Derivatives
(3)
Other
(4)
Total
Balance, December 31, 2003
$ (70)
$ (2,094) $ (270) $ (2,434)
Net change in fair value recorded in Accumulated OCI
1,088
(294) (18) 776
Net realized (gains) losses reclassified into earnings
(5)
(1,215)
109 – (1,106)
Balance, December 31, 2004
(197)
(2,279) (288) (2,764)
Net change in fair value recorded in Accumulated OCI (1,907) (2,225) 48 (4,084)
Net realized (gains) losses reclassified into earnings (5) (874) 166 – (708)
Balance, December 31, 2005
(2,978)
(4,338) (240) (7,556)
Net change in fair value recorded in Accumulated OCI
465 534 (1,091) (92)
Net realized (gains) losses reclassified into earnings
(5)
(220) 107 50 (63)
Balance, December 31, 2006
$ (2,733) $ (3,697) $(1,281) $ (7,711)
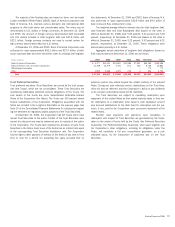
(1) In 2006, 2005, and 2004, the Corporation reclassified net realized (gains) losses into earnings on the sales of AFS debt securities of $279 million, $(683) million, and $(1.1) billion, respectively, and (gains) losses on the
sales of AFS marketable equity securities of $(499) million, $(191) million, and $(129) million, respectively.
(2) Accumulated OCI includes fair value gain of $135 million on certain retained interests in the Corporation’s securitization transactions at December 31, 2006.
(3) The amount included in Accumulated OCI for terminated derivative contracts were losses of $3.2 billion and $2.5 billion, net-of-tax, at December 31, 2006 and 2005, and gains of $143 million, net-of-tax, at December 31,
2004.
(4) At December 31, 2006, Accumulated OCI includes the accumulated adjustment to initially apply FASB Statement No. 158 of $(1,428) million.
(5) Included in this line item are amounts related to derivatives used in cash flow hedge relationships. These amounts are reclassified into earnings in the same year or years during which the hedged forecasted transactions
affect earnings. This line item also includes gains (losses) on AFS securities. These amounts are reclassified into earnings upon sale of the related security.
Earnings per Common Share
The calculation of earnings per common share and diluted earnings per common share for 2006, 2005, and 2004 is presented below. See Note 1 of the
Consolidated Financial Statements for a discussion on the calculation of earnings per common share.
(Dollars in millions, except per share information; shares in thousands) 2006 2005 2004
Earnings per common share
Net income
$ 21,133
$ 16,465 $ 13,947
Preferred stock dividends
(22)
(18) (16)
Net income available to common shareholders
$ 21,111
$ 16,447 $ 13,931
Average common shares issued and outstanding
4,526,637
4,008,688 3,758,507
Earnings per common share
$ 4.66
$ 4.10 $ 3.71
Diluted earnings per common share
Net income available to common shareholders
$ 21,111
$ 16,447 $ 13,931
Convertible preferred stock dividends
–
–2
Net income available to common shareholders and assumed conversions
$ 21,111
$ 16,447 $ 13,933
Average common shares issued and outstanding
4,526,637
4,008,688 3,758,507
Dilutive potential common shares
(1, 2)
69,259
59,452 65,436
Total diluted average common shares issued and outstanding
4,595,896
4,068,140 3,823,943
Diluted earnings per common share
$ 4.59
$ 4.04 $ 3.64
(1) For 2006, 2005 and 2004, average options to purchase 355 thousand, 39 million and 62 million shares, respectively, were outstanding but not included in the computation of earnings per common share because they were
antidilutive.
(2) Includes incremental shares from restricted stock units, restricted stock shares and stock options.
Bank of America 2006
135