Bank of America 2006 Annual Report Download - page 73
Download and view the complete annual report
Please find page 73 of the 2006 Bank of America annual report below. You can navigate through the pages in the report by either clicking on the pages listed below, or by using the keyword search tool below to find specific information within the annual report.-
 1
1 -
2
-
3
-
4
-
5
-
6
-
7
-
8
-
9
-
10
-
11
-
12
-
13
-
14
-
15
-
16
-
17
-
18
-
19
-
20
-
21
-
22
-
23
-
24
-
25
-
26
-
27
-
28
-
29
-
30
-
31
-
32
-
33
-
34
-
35
-
36
-
37
-
38
-
39
-
40
-
41
-
42
-
43
-
44
-
45
-
46
-
47
-
48
-
49
-
50
-
51
-
52
-
53
-
54
-
55
-
56
-
57
-
58
-
59
-
60
-
61
-
62
-
 63
63 -
 64
64 -
 65
65 -
 66
66 -
 67
67 -
 68
68 -
 69
69 -
 70
70 -
 71
71 -
 72
72 -
 73
73 -
 74
74 -
 75
75 -
 76
76 -
 77
77 -
 78
78 -
 79
79 -
 80
80 -
 81
81 -
 82
82 -
 83
83 -
84
-
85
-
86
-
87
-
88
-
89
-
90
-
91
-
92
-
93
-
94
-
95
-
96
-
97
-
98
-
99
-
100
-
101
-
102
-
103
-
104
-
105
-
106
-
107
-
108
-
109
-
110
-
111
-
112
-
113
-
114
-
115
-
116
-
117
-
118
-
119
-
120
-
121
-
122
-
123
-
124
-
125
-
126
-
127
-
128
-
129
-
130
-
131
-
132
-
133
-
134
-
135
-
136
-
137
-
138
-
139
-
140
-
141
-
142
-
143
-
144
-
145
-
146
-
147
-
148
-
149
-
150
-
151
-
152
-
153
-
154
-
155
 |
 |

Foreign Portfolio
Our foreign credit and trading portfolio is subject to country risk. We define
country risk as the risk of loss from unfavorable economic and political
developments, currency fluctuations, social instability and changes in
government policies. A risk management framework is in place to meas-
ure, monitor and manage foreign risk and exposures. Management over-
sight of country risk including cross-border risk is provided by the Country
Risk Committee.
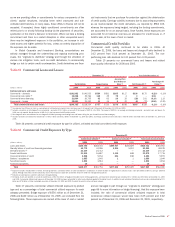
Table 23 presents total foreign exposure broken out by region at
December 31, 2006 and 2005. Total foreign exposure includes credit
exposure net of local liabilities, securities, and other investments domi-
ciled in countries other than the United States. Credit card exposure is
reported on a funded basis. Total foreign exposure can be adjusted for
externally guaranteed outstandings and certain collateral types. Out-
standings which are assigned external guarantees are reported under the
country of the guarantor. Outstandings with tangible collateral are reflected
in the country where the collateral is held. For securities received, other
than cross-border resale agreements, outstandings are assigned to the
domicile of the issuer of the securities. In regulatory reports under Federal
Financial Institutions Examination Council (FFIEC) guidelines, cross-border
resale agreements are presented based on the domicile of the issuer of
the securities that are held as collateral. However, for the purpose of the
following tables, resale agreements are generally presented based on the
domicile of the counterparty because the counterparty has the legal obliga-
tion for repayment.
Table 23 Regional Foreign Exposure (1,2)
December 31
(Dollars in millions) 2006 2005
Europe
$ 85,279
$55,068
Asia Pacific
(3)
27,403
13,938
Latin America
(4)
8,998
10,551
Middle East
811
616
Africa
317
86
Other
(5)
7,131
4,550
Total
$129,939
$84,809
(1) Generally, cross-border resale agreements are presented based on the domicile of the counterparty
because the counterparty has the legal obligation for repayment except where the underlying securities
are U.S. Treasuries, in which case the domicile is the U.S., and are therefore excluded from this
presentation. For regulatory reporting under FFIEC guidelines, cross-border resale agreements are
presented based on the domicile of the issuer of the securities that are held as collateral.
(2) Derivative assets are reported on a mark-to-market basis and have been reduced by the amount of cash
collateral applied of $4.3 billion and $7.4 billion at December 31, 2006 and 2005.
(3) Includes Australia and New Zealand.
(4) Includes Bermuda and Cayman Islands.
(5) Other includes Canada and supranational entities.
Our total foreign exposure was $129.9 billion at December 31,
2006, an increase of $45.1 billion from December 31, 2005. The growth
in our foreign exposure during 2006 was concentrated in Europe, which
accounted for $85.3 billion, or 66 percent, of total foreign exposure. The
European exposure was mostly in Western Europe and was distributed
across a variety of industries with the largest concentration in the private
sector which accounted for approximately 67 percent of the total exposure
in Europe. The growth in Western Europe was due to the organic growth of
$20.1 billion primarily driven by our Global Corporate and Investment
Banking business, as well as the $10.0 billion addition of MBNA
exposures in the United Kingdom, Ireland and Spain.
Asia Pacific was our second largest foreign exposure at $27.4 billion,
or 21 percent, of total foreign exposure at December 31, 2006. The
growth in Asia Pacific was driven by higher securities trading exposure
primarily in Japan, South Korea and Australia. Loans and Leases, loan
commitments, and other financing in Australia also contributed to the
increase in Asia Pacific.
Latin America accounted for $9.0 billion, or seven percent of total
foreign exposure at December 31, 2006, a decline of $1.6 billion, or 15
percent, from December 31, 2005. The decline in exposure in Latin Amer-
ica was primarily due to the sale of our Brazilian operations, partially offset
by the equity in Banco Itaú received in exchange for the sale, and a
decline in local country exposure in Chile. These decreases were partially
offset by an increase in cross-border exposure in Mexico.
For more information on our Asia Pacific and Latin America exposure,
see discussion on foreign exposure to selected countries defined as
emerging markets on page 72.
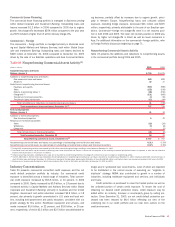
As presented in Table 24, at December 31, 2006 and 2005, the
United Kingdom had total cross-border exposure of $17.3 billion and
$21.2 billion, representing 1.18 percent and 1.64 percent of Total Assets.
At December 31, 2006 and 2005, the United Kingdom was the only coun-
try whose total cross-border outstandings exceeded one percent of our
total assets. At December 31, 2006, the largest concentration of the
cross-border exposure to the United Kingdom was in the banking sector. At
December 31, 2006 and 2005, Germany was the only country whose total
cross-border outstandings of $12.6 billion and $10.0 billion were between
0.75 percent and one percent of total assets.
Table 24 Total Cross-border Exposure Exceeding One Percent of Total Assets (1,2)
(Dollars in millions) December 31 Public Sector Banks Private Sector
Cross-border
Exposure
Exposure as a
Percentage
of Total
Assets
United Kingdom
2006 $ 53 $9,172 $ 8,059 $17,284 1.18%
2005
298 7,272 13,616 21,186 1.64
2004
74 1,585 8,481 10,140 0.91
(1) Exposure includes cross-border claims by our foreign offices as follows: loans, accrued interest receivable, acceptances, time deposits placed, trading account assets, securities, derivative assets, other interest-earning
investments and other monetary assets. Amounts also include unused commitments, SBLCs, commercial letters of credit and formal guarantees. Sector definitions are based on the FFIEC instructions for preparing the
Country Exposure Report.
(2) Derivative assets are reported on a mark-to-market basis and have been reduced by the amount of cash collateral applied of $1.2 billion, $1.8 billion, and $1.8 billion at December 31, 2006, 2005, and 2004, respectively.
Bank of America 2006
71