Bank of America 2006 Annual Report Download - page 142
Download and view the complete annual report
Please find page 142 of the 2006 Bank of America annual report below. You can navigate through the pages in the report by either clicking on the pages listed below, or by using the keyword search tool below to find specific information within the annual report.-
 1
1 -
2
-
3
-
4
-
5
-
6
-
7
-
8
-
9
-
10
-
11
-
12
-
13
-
14
-
15
-
16
-
17
-
18
-
19
-
20
-
21
-
22
-
23
-
24
-
25
-
26
-
27
-
28
-
29
-
30
-
31
-
32
-
33
-
34
-
35
-
36
-
37
-
38
-
39
-
40
-
41
-
42
-
43
-
44
-
45
-
46
-
47
-
48
-
49
-
50
-
51
-
52
-
53
-
54
-
55
-
56
-
57
-
58
-
59
-
60
-
61
-
62
-
63
-
64
-
65
-
66
-
67
-
68
-
69
-
70
-
71
-
72
-
73
-
74
-
75
-
76
-
77
-
78
-
79
-
80
-
81
-
82
-
83
-
84
-
85
-
86
-
87
-
88
-
89
-
90
-
91
-
92
-
93
-
94
-
95
-
96
-
97
-
98
-
99
-
100
-
101
-
102
-
103
-
104
-
105
-
106
-
107
-
108
-
109
-
110
-
111
-
112
-
113
-
114
-
115
-
116
-
117
-
118
-
119
-
120
-
121
-
122
-
123
-
124
-
125
-
126
-
127
-
128
-
129
-
130
-
131
-
 132
132 -
 133
133 -
 134
134 -
 135
135 -
 136
136 -
 137
137 -
 138
138 -
 139
139 -
 140
140 -
 141
141 -
 142
142 -
 143
143 -
 144
144 -
 145
145 -
 146
146 -
 147
147 -
 148
148 -
 149
149 -
 150
150 -
 151
151 -
 152
152 -
153
-
154
-
155
 |
 |

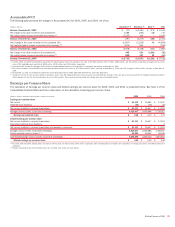
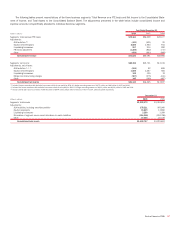
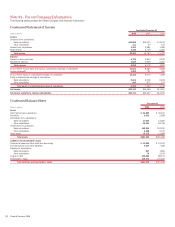
Amounts recognized in the Consolidated Financial Statements at December 31, 2006 and 2005 were as follows:
December 31, 2006
(Dollars in millions)
Qualified
Pension Plans
Nonqualified
Pension Plans
Postretirement
Health and Life
Plans
Other assets
$ 4,113 $ – $ –
Accrued expenses and other liabilities
– (1,345) (1,459)
Net amount recognized at December 31
$ 4,113 $(1,345) $(1,459)
December 31, 2005
(Dollars in millions)
Qualified
Pension Plans
Nonqualified
Pension Plans
Postretirement
Health and Life
Plans
Prepaid benefit cost
$4,237
$— $—
Accrued benefit cost
—
(897) (981)
Additional minimum liability
—
(187) —
SFAS 87 Accumulated OCI adjustment
(1)
— 187 —
Net amount recognized at December 31 $4,237 $ (897) $ (981)
(1) Amount recognized in Accumulated OCI net of tax is $118 million.
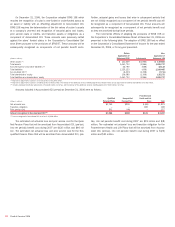
Net periodic benefit cost for 2006, 2005 and 2004 included the following components:
Qualified
Pension Plans
Nonqualified
Pension Plans
Postretirement
Health and Life Plans
(Dollars in millions) 2006 2005 2004 2006 2005 2004 2006 2005 2004
Components of net periodic benefit cost
Service cost
$ 306
$ 261 $ 257
$13
$11 $27
$13
$11 $ 9
Interest cost
676
643 623
78
61 62
86
78 76
Expected return on plan assets
(1,034)
(983) (915)
–
––
(10)
(14) (16)
Amortization of transition obligation
–
––
–
––
31
31 32
Amortization of prior service cost (credits)
41
44 55
(8)
(8) 3
–
–1
Recognized net actuarial loss
229
182 92
20
24 14
12
80 74
Recognized loss due to settlements and curtailments
–
––
–
9–
–
––
Net periodic benefit cost
$ 218
$ 147 $ 112
$ 103
$ 97 $ 106
$ 132
$ 186 $ 176
Weighted average assumptions used to determine net cost for
years ended December 31
Discount rate
(1)
5.50%
5.75% 6.25%
5.50%
5.75% 6.25%
5.50%
5.75% 6.25%
Expected return on plan assets
8.00
8.50 8.50
n/a
n/a n/a
8.00
8.50 8.50
Rate of compensation increase
4.00
4.00 4.00
4.00
4.00 4.00
n/a
n/a n/a
(1) In connection with the FleetBoston merger, their plans were remeasured on April 1, 2004, using a discount rate of 6.00 percent.
n/a = not applicable
Net periodic postretirement health and life expense was determined
using the “projected unit credit” actuarial method. Gains and losses for all
benefits except postretirement health care are recognized in accordance
with the standard amortization provisions of the applicable accounting
standards. For the Postretirement Health Care Plans, 50 percent of the
unrecognized gain or loss at the beginning of the fiscal year (or at sub-
sequent remeasurement) is recognized on a level basis during the year.
Assumed health care cost trend rates affect the postretirement bene-
fit obligation and benefit cost reported for the Postretirement Health Care
Plans. The assumed health care cost trend rate used to measure the
expected cost of benefits covered by the Postretirement Health Care Plans
was 9.0 percent for 2007, reducing in steps to 5.0 percent in 2012 and
later years. A one-percentage-point increase in assumed health care cost
trend rates would have increased the service and interest costs and the
benefit obligation by $3 million and $51 million in 2006, $3 million and
$51 million in 2005, and $4 million and $56 million in 2004. A
one-percentage-point decrease in assumed health care cost trend rates
would have lowered the service and interest costs and the benefit obliga-
tion by $3 million and $44 million in 2006, $3 million and $43 million in
2005, and $3 million and $48 million in 2004.
Plan Assets
The Qualified Pension Plans have been established as retirement vehicles
for participants, and trusts have been established to secure benefits
promised under the Qualified Pension Plans. The Corporation’s policy is to
invest the trust assets in a prudent manner for the exclusive purpose of
providing benefits to participants and defraying reasonable expenses of
administration. The Corporation’s investment strategy is designed to pro-
vide a total return that, over the long-term, increases the ratio of assets to
liabilities. The strategy attempts to maximize the investment return on
assets at a level of risk deemed appropriate by the Corporation while
complying with ERISA and any applicable regulations and laws. The
investment strategy utilizes asset allocation as a principal determinant for
establishing the risk/reward profile of the assets. Asset allocation ranges
are established, periodically reviewed, and adjusted as funding levels and
liability characteristics change. Active and passive investment managers
are employed to help enhance the risk/return profile of the assets. An
additional aspect of the investment strategy used to minimize risk (part of
the asset allocation plan) includes matching the equity exposure of
participant-selected earnings measures. For example, the common stock
of the Corporation held in the trust is maintained as an offset to the
140
Bank of America 2006