Bank of America 2006 Annual Report Download - page 56
Download and view the complete annual report
Please find page 56 of the 2006 Bank of America annual report below. You can navigate through the pages in the report by either clicking on the pages listed below, or by using the keyword search tool below to find specific information within the annual report.-
 1
1 -
2
-
3
-
4
-
5
-
6
-
7
-
8
-
9
-
10
-
11
-
12
-
13
-
14
-
15
-
16
-
17
-
18
-
19
-
20
-
21
-
22
-
23
-
24
-
25
-
26
-
27
-
28
-
29
-
30
-
31
-
32
-
33
-
34
-
35
-
36
-
37
-
38
-
39
-
40
-
41
-
42
-
43
-
44
-
45
-
 46
46 -
 47
47 -
 48
48 -
 49
49 -
 50
50 -
 51
51 -
 52
52 -
 53
53 -
 54
54 -
 55
55 -
 56
56 -
 57
57 -
 58
58 -
 59
59 -
 60
60 -
 61
61 -
 62
62 -
 63
63 -
 64
64 -
 65
65 -
 66
66 -
67
-
68
-
69
-
70
-
71
-
72
-
73
-
74
-
75
-
76
-
77
-
78
-
79
-
80
-
81
-
82
-
83
-
84
-
85
-
86
-
87
-
88
-
89
-
90
-
91
-
92
-
93
-
94
-
95
-
96
-
97
-
98
-
99
-
100
-
101
-
102
-
103
-
104
-
105
-
106
-
107
-
108
-
109
-
110
-
111
-
112
-
113
-
114
-
115
-
116
-
117
-
118
-
119
-
120
-
121
-
122
-
123
-
124
-
125
-
126
-
127
-
128
-
129
-
130
-
131
-
132
-
133
-
134
-
135
-
136
-
137
-
138
-
139
-
140
-
141
-
142
-
143
-
144
-
145
-
146
-
147
-
148
-
149
-
150
-
151
-
152
-
153
-
154
-
155
 |
 |

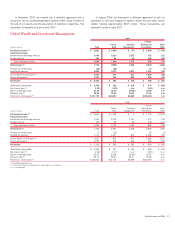
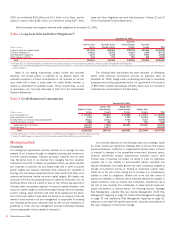
Balance Sheet
Average Balance
(Dollars in millions) 2006 2005
Total loans and leases $ 61,497 $ 54,102
Total earning assets
(1)
117,916 119,607
Total assets
(1)
125,663 127,394
Total deposits 115,071 117,338
Allocated equity 10,358 10,284
December 31
2006 2005
Total loans and leases
$ 66,034
$ 58,380
Total earning assets
(1)
129,589
121,269
Total assets
(1)
137,739
129,232
Total deposits
125,622
115,454
Allocated equity
11,007
12,813
(1) Total earning assets and Total Assets include asset allocations to match liabilities (i.e., deposits).
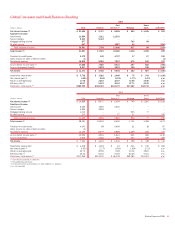
Global Wealth and Investment Management provides a wide offering of
customized banking and investment services tailored to meet the changing
wealth management goals of our individual and institutional customer
base. Our clients have access to a range of services offered through three
primary businesses: The Private Bank, Columbia Management (Columbia),
and Premier Banking and Investments (PB&I). In addition, ALM/Other
includes the impact of Banc of America Specialist, the results of ALM
activities and the impact of migrating qualifying affluent customers from
Global Consumer and Small Business Banking to our PB&I customer serv-
ice model.
Net Income increased $87 million, or four percent, due to higher
Total Revenue partially offset by higher Noninterest Expense.
Net Interest Income increased $61 million, or two percent, due to
increases in deposit spreads and higher Average Loans and Leases,
largely offset by a decline in ALM activities and loan spread compression.
Global Wealth and Investment Management also benefited from the migra-
tion of deposits from Global Consumer and Small Business Banking.
Noninterest Income increased $402 million, or 11 percent, due to
increases in Investment and Brokerage Services driven by higher levels of
assets under management. Noninterest Income also benefited from non-
recurring items in 2006.
Provision for Credit Losses decreased $33 million due to a credit
loss recovery in 2006.
Noninterest expense increased $295 million, or eight percent, primar-
ily due to increases in Personnel expense driven by the addition of sales
associates and revenue generating expenses.
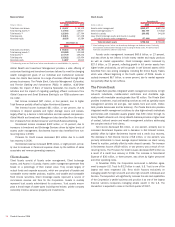
Client Assets
Client Assets consist of Assets under management, Client brokerage
assets, and Assets in Custody. Assets under management generate fees
based on a percentage of their market value. They consist largely of
mutual funds and separate accounts, which are comprised of taxable and
nontaxable money market products, equities, and taxable and nontaxable
fixed income securities. Client brokerage assets represent a source of
commission revenue and fees for the Corporation. Assets in custody
represent trust assets administered for customers. Trust assets encom-
pass a broad range of asset types including real estate, private company
ownership interest, personal property and investments.
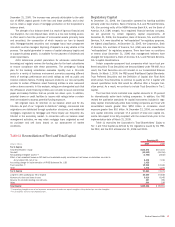
Client Assets
December 31
(Dollars in millions) 2006 2005
Assets under management
$542,977
$482,394
Client brokerage assets
(1)
203,799
176,822
Assets in custody
100,982
94,184
Less: Client brokerage assets and Assets in custody
included in Assets under management
(57,446)
(44,931)
Total net client assets
$790,312
$708,469
(1) Client brokerage assets include non-discretionary brokerage and fee-based assets. Previously,
the Corporation reported Client brokerage assets excluding fee-based assets. The 2005 amounts
have been reclassified to reflect this adjustment.
Assets under management increased $60.6 billion, or 13 percent,
and was driven by net inflows in both money market and equity products
as well as market appreciation. Client brokerage assets increased by
$27.0 billion, or 15 percent, reflecting growth in full service assets from
higher broker productivity, as well as growth in self directed assets which
benefited from new pricing strategies including $0 Online Equity Trades
which were offered beginning in the fourth quarter of 2006. Assets in
custody increased $6.7 billion, or seven percent, due to market apprecia-
tion partially offset by net outflows.
The Private Bank
The Private Bank provides integrated wealth management solutions to high
net-worth individuals, middle-market institutions and charitable orga-
nizations with investable assets greater than $3 million. The Private Bank
provides investment, trust and banking services as well as specialty asset
management services (oil and gas, real estate, farm and ranch, timber-
land, private businesses and tax advisory). The Private Bank also provides
integrated wealth management solutions to ultra high-net-worth individuals
and families with investable assets greater than $50 million through its
Family Wealth Advisors unit. Family Wealth Advisors provides a higher level
of contact, tailored service and wealth management solutions addressing
the complex needs of their clients.
Net Income decreased $6 million, or one percent, primarily due to
increased Noninterest Expense and a decrease in Net Interest Income,
partially offset by higher Noninterest Income and a credit loss recovery.
The decrease in Net Interest Income of $8 million, or one percent, was
primarily attributable to lower average deposit balances as client money
flowed to equities, partially offset by wider deposit spreads. The increase
in Noninterest Income of $19 million, or two percent, was a result of non-
recurring items. The Provision for Credit Losses decreased $29 million as
a result of a credit loss recovery in 2006. The increase in Noninterest
Expense of $36 million, or three percent, was driven by higher personnel
and other operating costs.
In November 2006, the Corporation announced a definitive agree-
ment to acquire U.S. Trust for $3.3 billion in cash. U.S. Trust is one of the
largest and most respected U.S. firms which focuses exclusively on
managing wealth for high net-worth and ultra high net-worth individuals and
families. The acquisition will significantly increase the size and capabilities
of the Corporation’s wealth business and position it as one of the largest
financial services companies managing private wealth in the U.S. The
transaction is expected to close in the third quarter of 2007.
54
Bank of America 2006