Bank of America 2006 Annual Report Download - page 57
Download and view the complete annual report
Please find page 57 of the 2006 Bank of America annual report below. You can navigate through the pages in the report by either clicking on the pages listed below, or by using the keyword search tool below to find specific information within the annual report.-
 1
1 -
2
-
3
-
4
-
5
-
6
-
7
-
8
-
9
-
10
-
11
-
12
-
13
-
14
-
15
-
16
-
17
-
18
-
19
-
20
-
21
-
22
-
23
-
24
-
25
-
26
-
27
-
28
-
29
-
30
-
31
-
32
-
33
-
34
-
35
-
36
-
37
-
38
-
39
-
40
-
41
-
42
-
43
-
44
-
45
-
46
-
 47
47 -
 48
48 -
 49
49 -
 50
50 -
 51
51 -
 52
52 -
 53
53 -
 54
54 -
 55
55 -
 56
56 -
 57
57 -
 58
58 -
 59
59 -
 60
60 -
 61
61 -
 62
62 -
 63
63 -
 64
64 -
 65
65 -
 66
66 -
 67
67 -
68
-
69
-
70
-
71
-
72
-
73
-
74
-
75
-
76
-
77
-
78
-
79
-
80
-
81
-
82
-
83
-
84
-
85
-
86
-
87
-
88
-
89
-
90
-
91
-
92
-
93
-
94
-
95
-
96
-
97
-
98
-
99
-
100
-
101
-
102
-
103
-
104
-
105
-
106
-
107
-
108
-
109
-
110
-
111
-
112
-
113
-
114
-
115
-
116
-
117
-
118
-
119
-
120
-
121
-
122
-
123
-
124
-
125
-
126
-
127
-
128
-
129
-
130
-
131
-
132
-
133
-
134
-
135
-
136
-
137
-
138
-
139
-
140
-
141
-
142
-
143
-
144
-
145
-
146
-
147
-
148
-
149
-
150
-
151
-
152
-
153
-
154
-
155
 |
 |

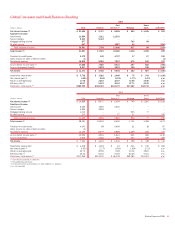
Columbia Management
Columbia is an asset management business serving the needs of both
institutional clients and individual customers. Columbia provides asset
management services, including mutual funds, liquidity strategies and
separate accounts. Columbia mutual fund offerings provide a broad array
of investment strategies and products including equities, fixed income
(taxable and non-taxable) and money market (taxable and non-taxable)
funds. Columbia distributes its products and services directly to institu-
tional clients, and distributes to individuals through The Private Bank,
Family Wealth Advisors, Premier Banking and Investments, and non-
proprietary channels including other brokerage firms.
Net Income increased $43 million, or 15 percent, primarily as a
result of an increase in Investment and Brokerage Services of $211 mil-
lion, or 16 percent, in 2006. This increase is due to higher assets under
management driven by net inflows in money market and equity funds, and
market appreciation. Noninterest Expense increased $105 million, or 12
percent, primarily due to higher Personnel costs including revenue-based
compensation and other operating costs.
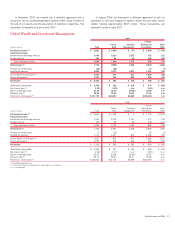
Premier Banking and Investments
Premier Banking and Investments includes Banc of America Investments,
our full-service retail brokerage business and our Premier Banking channel.
PB&I brings personalized banking and investment expertise through priority
service with client-dedicated teams. PB&I provides a high-touch client
experience through a network of approximately 4,400 client advisors to
our affluent customers with a personal wealth profile that includes invest-
able assets plus a mortgage that exceeds $500,000 or at least
$100,000 of investable assets.
Net Income increased $138 million, or 17 percent, primarily due to
an increase in Net Interest Income. The increase in Net Interest Income of
$268 million, or 15 percent, was primarily driven by higher deposit
spreads partially offset by lower average deposit balances. Deposit
spreads increased 40 bps to 2.34 percent. Net Interest Income also bene-
fited from higher Average Loans and Leases, mainly residential mortgages
and home equity.
Noninterest Income increased $60 million, or seven percent, primar-
ily driven by higher Investment and Brokerage Services. Noninterest
Expense increased $95 million, or eight percent, primarily due to
increases in Personnel expense driven by the PB&I expansion of Client
Managers and Financial Advisors and higher performance-based
compensation.
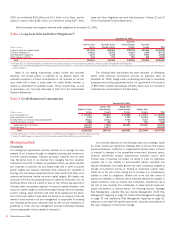
ALM/Other
We migrate qualifying affluent customers, and their related deposit balan-
ces and associated Net Interest Income from the Global Consumer and
Small Business Banking segment to our PB&I customer service model. In
order to provide a view of organic growth in PB&I, we allocate the original
migrated deposit balances, including attrition, as well as the correspond-
ing Net Interest Income at original spreads from PB&I to ALM/Other.
Net Income decreased $88 million, or 13 percent, primarily due to a
decrease in Net Interest Income partially offset by an increase in Non-
interest Income. Net Interest Income decreased $156 million driven by a
significant reduction from ALM activities, partially offset by higher Net
Interest Income on deposits due to migration of certain banking relation-
ships from Global Consumer and Small Business Banking. During 2006
and 2005, $10.7 billion and $16.9 billion of average deposit balances
were migrated from the Global Consumer and Small Business Banking
segment to Global Wealth and Investment Management. The total cumu-
lative average impact of migrated balances was $48.5 billion in 2006
compared to $39.3 billion for 2005. Noninterest Income increased $101
million primarily reflecting nonrecurring items in 2006.
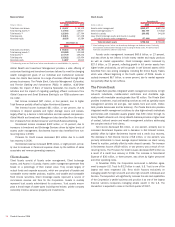
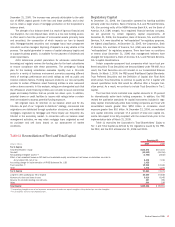
All Other
(Dollars in millions) 2006 2005
Net interest income (1)
$ 141
$ (305)
Noninterest income
Equity investment gains
2,866
1,964
All other income
(921)
(975)
Total noninterest income
1,945
989
Total revenue (1)
2,086
684
Provision for credit losses
(116)
69
Gains (losses) on sales of debt securities
(495)
823
Merger and restructuring charges
(2)
805
412
All other noninterest expense
(41)
302
Income before income taxes
(1)
943
724
Income tax expense (benefit)
176
(20)
Net income
$ 767
$ 744
Shareholder value added
$ (306)
$ (953)
(1) Fully taxable-equivalent basis
(2) For more information on Merger and Restructuring Charges, see Note 2 of the Consolidated Financial
Statements.
Included in All Other are our Equity Investments businesses and Other.
Equity Investments includes Principal Investing, Corporate Invest-
ments and Strategic Investments. Principal Investing is comprised of a
diversified portfolio of investments in privately-held and publicly-traded
companies at all stages of their life cycle from start-up to buyout. These
investments are made either directly in a company or held through a fund
and are accounted for at fair value. See Note 1 of the Consolidated Finan-
cial Statements for more information on the accounting for the Principal
Investing portfolio. Corporate Investments primarily includes investments
in publicly-traded equity securities and funds and are accounted for as AFS
marketable equity securities. Strategic Investments includes the Corpo-
ration’s strategic investments such as CCB, Grupo Financiero Santander
Serfin (Santander), Banco Itaú and other investments. The restricted
shares of CCB and Banco Itaú are currently carried at cost but, as required
by GAAP, will be accounted for as AFS marketable equity securities and
carried at fair value with an offset to Accumulated Other Comprehensive
Income (OCI) starting one year prior to the lapse of their restrictions. See
Note 5 of the Consolidated Financial Statements for more information on
our strategic investments. Our investment in Santander is accounted for
under the equity method of accounting. Income associated with Equity
Investments is recorded in Equity Investment Gains and includes gains
(losses) on sales of these equity investments, dividends, and valuations
that primarily relate to the Principal Investing portfolio.
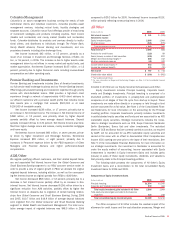
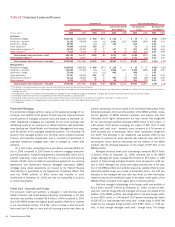
The following table presents the components of All Other’s Equity
Investment Gains and a reconciliation to the total consolidated Equity
Investment Gains for 2006 and 2005.
Components of Equity Investment Gains
(Dollars in millions) 2006 2005
Principal Investing
$1,894
$1,500
Corporate and Strategic Investments
972
464
Total equity investment gains included in All Other
2,866
1,964
Total equity investment gains included in the business
segments
323
248
Total consolidated equity investment gains
$3,189
$2,212
The Other component of All Other includes the residual impact of the
allowance for credit losses and the cost allocation processes, Merger and
Bank of America 2006
55