Bank of America 2006 Annual Report Download - page 38
Download and view the complete annual report
Please find page 38 of the 2006 Bank of America annual report below. You can navigate through the pages in the report by either clicking on the pages listed below, or by using the keyword search tool below to find specific information within the annual report.-
 1
1 -
2
-
3
-
4
-
5
-
6
-
7
-
8
-
9
-
10
-
11
-
12
-
13
-
14
-
15
-
16
-
17
-
18
-
19
-
20
-
21
-
22
-
23
-
24
-
25
-
26
-
27
-
 28
28 -
 29
29 -
 30
30 -
 31
31 -
 32
32 -
 33
33 -
 34
34 -
 35
35 -
 36
36 -
 37
37 -
 38
38 -
 39
39 -
 40
40 -
 41
41 -
 42
42 -
 43
43 -
 44
44 -
 45
45 -
 46
46 -
 47
47 -
 48
48 -
49
-
50
-
51
-
52
-
53
-
54
-
55
-
56
-
57
-
58
-
59
-
60
-
61
-
62
-
63
-
64
-
65
-
66
-
67
-
68
-
69
-
70
-
71
-
72
-
73
-
74
-
75
-
76
-
77
-
78
-
79
-
80
-
81
-
82
-
83
-
84
-
85
-
86
-
87
-
88
-
89
-
90
-
91
-
92
-
93
-
94
-
95
-
96
-
97
-
98
-
99
-
100
-
101
-
102
-
103
-
104
-
105
-
106
-
107
-
108
-
109
-
110
-
111
-
112
-
113
-
114
-
115
-
116
-
117
-
118
-
119
-
120
-
121
-
122
-
123
-
124
-
125
-
126
-
127
-
128
-
129
-
130
-
131
-
132
-
133
-
134
-
135
-
136
-
137
-
138
-
139
-
140
-
141
-
142
-
143
-
144
-
145
-
146
-
147
-
148
-
149
-
150
-
151
-
152
-
153
-
154
-
155
 |
 |

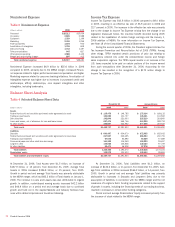
Preferred Stock and redeemed its 382,450 shares, or $96 million, of
6.75% Perpetual Preferred Stock. Both classes were redeemed at their
stated value of $250 per share, plus accrued and unpaid dividends.
In September 2006, the Corporation completed the sale of its Brazil-
ian operations in exchange for approximately $1.9 billion in equity of
Banco Itaú Holding Financeira S.A. (Banco Itaú), Brazil’s second largest
nongovernment-owned banking company. The sale resulted in a $720 mil-
lion gain (pre-tax) that was recorded in Other Income. In August 2006, we
announced a definitive agreement to sell our operations in Chile and
Uruguay for stock in Banco Itaú and other consideration totaling
approximately $615 million. These transactions, as well as the previously
announced sale of our operations in Argentina, are expected to close in
early 2007.
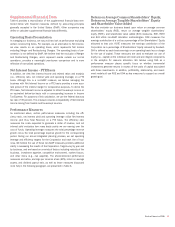
MBNA Merger Overview
The Corporation acquired 100 percent of the outstanding stock of MBNA
Corporation (MBNA) on January 1, 2006, for $34.6 billion. In connection
therewith 1,260 million shares of MBNA common stock were exchanged
for 631 million shares of the Corporation’s common stock. Prior to the
MBNA merger, this represented approximately 16 percent of the Corpo-
ration’s outstanding common stock. MBNA shareholders also received
cash of $5.2 billion. The MBNA merger was a tax-free merger for the
Corporation. The acquisition expands the Corporation’s customer base
and its opportunity to deepen customer relationships across the full
breadth of the Corporation by delivering innovative deposit, lending and
investment products and services to MBNA’s customer base. Additionally,
the acquisition allows the Corporation to significantly increase its affinity
relationships through MBNA’s credit card operations and sell these credit
cards through our delivery channels (including the retail branch network).
MBNA’s results of operations were included in the Corporation’s results
beginning January 1, 2006. The purchase price has been allocated to the
assets acquired and the liabilities assumed based on their fair values at
the MBNA merger date. For more information related to the MBNA merger,
see Note 2 of the Corporation’s Consolidated Financial Statements.
Economic Overview
In 2006, the U.S. economic performance was healthy as real Gross
Domestic Product grew an estimated annualized 3.4 percent. Consumer
spending remained resilient despite significant declines in housing and
mortgage refinancing activities. Global economies recorded another solid
year of growth, led by robust expansion in Asia. Importantly, Germany and
Japan maintained their economic momentum as the U.S. weathered a soft
patch in growth. The FRB concluded two consecutive years of rate hikes in
June, raising its rate to 5.25 percent, as increases remained on hold in
the second half of the year. The yield curve remained inverted for much of
the second half of the year, reflecting the FRB’s rate increases, its
inflation-fighting credibility, and rising foreign capital inflows. In response
to the rate hikes and removal of monetary accommodation, housing sales
and construction fell sharply, median house prices flattened after surging
for a half decade, and mortgage refinancing activity fell sharply. However,
business investment remained strong, and solid increases in non-
residential construction partially offset the declines in housing. Consumer
spending, buoyed by rising personal incomes, relative low interest rates
and record-breaking wealth, continued to grow, ending the year on a strong
note. Dramatic declines in oil and energy prices in August through October
sharply reduced inflation, while core measures of inflation, excluding the
volatile energy and food components, rose through September. Core
inflation drifted modestly lower through year end, but remained above the
two percent upper bound of the FRB’s comfort range. With the exception of
housing, automobiles and related industries sustained healthy product
demand and modest pricing power provided businesses record profits. In
this environment, businesses continued to hire, and the unemployment
rate receded to 4.5 percent, well below its historic average.
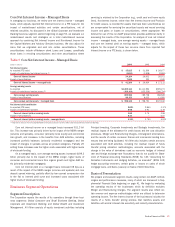
Performance Overview
Net Income reached $21.1 billion, or $4.59 per diluted common share in 2006, increases of 28 percent and 14 percent from $16.5 billion, or $4.04 per
diluted common share in 2005.
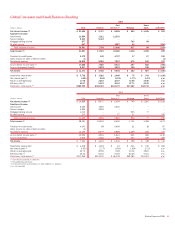
Table 1 Business Segment Total Revenue and Net Income
Total Revenue Net Income
(Dollars in millions) 2006 2005 2006 2005
Global Consumer and Small Business Banking
$41,691
$28,323
$11,171
$ 7,021
Global Corporate and Investment Banking
22,691
20,600
6,792
6,384
Global Wealth and Investment Management
7,779
7,316
2,403
2,316
All Other
2,086
684
767
744
Total FTE basis
(1)
74,247
56,923
21,133
16,465
FTE adjustment
(1)
(1,224)
(832)
––
Total Consolidated
$73,023
$56,091
$21,133
$16,465
(1) Total revenue for the business segments and All Other is on a fully taxable-equivalent (FTE) basis. For more information on a FTE basis, see Supplemental Financial Data beginning on page 41.
Global Consumer and Small Business Banking
Net Income increased $4.2 billion, or 59 percent, to $11.2 billion and
Total Revenue increased $13.4 billion, or 47 percent, to $41.7 billion in
2006 compared to 2005. These increases were driven by higher Net Inter-
est Income and Noninterest Income. Net Interest Income increased primar-
ily due to the MBNA merger and organic growth which increased Average
Loans and Leases. Noninterest Income increased primarily due to the
MBNA merger which resulted in an increase in Card Income driven by
increases in excess servicing income, cash advance fees, interchange
income and late fees. These increases were partially offset by higher
Noninterest Expense and Provision for Credit Losses, primarily driven by
the addition of MBNA. For more information on Global Consumer and
Small Business Banking, see page 45.
36
Bank of America 2006