Bank of America 2006 Annual Report Download - page 71
Download and view the complete annual report
Please find page 71 of the 2006 Bank of America annual report below. You can navigate through the pages in the report by either clicking on the pages listed below, or by using the keyword search tool below to find specific information within the annual report.-
 1
1 -
2
-
3
-
4
-
5
-
6
-
7
-
8
-
9
-
10
-
11
-
12
-
13
-
14
-
15
-
16
-
17
-
18
-
19
-
20
-
21
-
22
-
23
-
24
-
25
-
26
-
27
-
28
-
29
-
30
-
31
-
32
-
33
-
34
-
35
-
36
-
37
-
38
-
39
-
40
-
41
-
42
-
43
-
44
-
45
-
46
-
47
-
48
-
49
-
50
-
51
-
52
-
53
-
54
-
55
-
56
-
57
-
58
-
59
-
60
-
 61
61 -
 62
62 -
 63
63 -
 64
64 -
 65
65 -
 66
66 -
 67
67 -
 68
68 -
 69
69 -
 70
70 -
 71
71 -
 72
72 -
 73
73 -
 74
74 -
 75
75 -
 76
76 -
 77
77 -
 78
78 -
 79
79 -
 80
80 -
 81
81 -
82
-
83
-
84
-
85
-
86
-
87
-
88
-
89
-
90
-
91
-
92
-
93
-
94
-
95
-
96
-
97
-
98
-
99
-
100
-
101
-
102
-
103
-
104
-
105
-
106
-
107
-
108
-
109
-
110
-
111
-
112
-
113
-
114
-
115
-
116
-
117
-
118
-
119
-
120
-
121
-
122
-
123
-
124
-
125
-
126
-
127
-
128
-
129
-
130
-
131
-
132
-
133
-
134
-
135
-
136
-
137
-
138
-
139
-
140
-
141
-
142
-
143
-
144
-
145
-
146
-
147
-
148
-
149
-
150
-
151
-
152
-
153
-
154
-
155
 |
 |

Commercial Lease Financing
The commercial lease financing portfolio is managed in Business Lending
within Global Corporate and Investment Banking. Outstanding loans and
leases increased $1.2 billion in 2006 compared to 2005 due to organic
growth. Net charge-offs decreased $259 million compared to the prior year
as 2005 included a higher level of airline industry charge-offs.
Commercial – Foreign
The commercial – foreign portfolio is managed primarily in Business Lend-
ing and Capital Markets and Advisory Services, both within Global Corpo-
rate and Investment Banking. Outstanding loans and leases declined by
$649 million at December 31, 2006 compared to December 31, 2005
driven by the sale of our Brazilian operations and Asia Commercial Bank-
ing business, partially offset by increases due to organic growth, princi-
pally in Western Europe. Nonperforming loans and criticized utilized
exposure, excluding bridge exposure, decreased $21 million and $215
million, respectively, primarily attributable to the sale of our Brazilian oper-
ations. Commercial—foreign net charge-offs were in a net recovery posi-
tion in both 2006 and 2005. The lower net recovery position in 2006 was
driven by higher net charge-offs in Brazil as well as lower recoveries in
Asia. For additional information on the commercial—foreign portfolio, refer
to Foreign Portfolio discussion beginning on page 71.
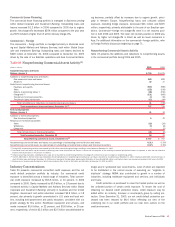
Nonperforming Commercial Assets Activity
Table 19 presents the additions and reductions to nonperforming assets
in the commercial portfolio during 2006 and 2005.
Table 19 Nonperforming Commercial Assets Activity (1)
(Dollars in millions) 2006 2005
Nonperforming loans and leases
Balance, January 1
$ 726
$1,475
Additions to nonperforming loans and leases:
New nonaccrual loans and leases
980
892
Advances
32
37
Reductions in nonperforming loans and leases:
Paydowns and payoffs
(403)
(686)
Sales
(152)
(108)
Returns to performing status
(2)
(80)
(152)
Charge-offs
(3)
(331)
(669)
Transfers to foreclosed properties
(3)
(19)
Transfers to loans held-for-sale
(12)
(44)
Total net additions to (reductions in) nonperforming loans and leases
31
(749)
Total nonperforming loans and leases, December 31 (4)
757
726
Foreclosed properties
Balance, January 1
31
33
Additions to foreclosed properties:
New foreclosed properties
6
32
Reductions in foreclosed properties:
Sales
(18)
(24)
Writedowns
(9)
(8)
Charge-offs
–
(2)
Total net reductions in foreclosed properties
(21)
(2)
Total foreclosed properties, December 31
10
31
Nonperforming commercial assets, December 31 (5)
$ 767
$ 757
Nonperforming commercial loans and leases as a percentage of outstanding commercial loans and leases
0.31%
0.33%
Nonperforming commercial assets as a percentage of outstanding commercial loans, leases and foreclosed properties
0.32%
0.35%
(1) During 2005, nonperforming securities were reduced by $140 million primarily through exchanges resulting in a zero balance at December 31, 2005.
(2) Commercial loans and leases may be restored to performing status when all principal and interest is current and full repayment of the remaining contractual principal and interest is expected, or when the loan otherwise
becomes well-secured and is in the process of collection.
(3) Certain loan and lease products, including business card, are not classified as nonperforming; therefore, the charge-offs on these loans have no impact on nonperforming activity.
(4) In 2006, $85 million in Interest Income was estimated to be contractually due on nonperforming commercial loans and leases classified as nonperforming at December 31, 2006, including troubled debt restructured loans of
which $2 million were performing at December 31, 2006 and not included in the table above. Approximately $38 million of the estimated $85 million in contractual interest was received and included in Net Income for 2006.
(5) Balances do not include nonperforming loans held-for-sale included in Other Assets of $50 million and $45 million at December 31, 2006 and 2005.
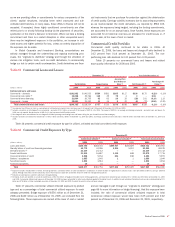
Industry Concentrations
Table 20 presents commercial committed credit exposure and the net
credit default protection portfolio by industry. Our commercial credit
exposure is diversified across a broad range of industries. Total commer-
cial credit exposure increased by $53.8 billion, or 10 percent, in 2006
compared to 2005. Banks increased by $5.9 billion, or 19 percent due to
increased activity in Capital Markets and Advisory Services within Global
Corporate and Investment Banking, primarily in Australia and the United
Kingdom. Government and public education increased $5.9 billion, or 18
percent, due primarily to growth concentrated in U.S. state and local enti-
ties, including both government and public education, consistent with our
growth strategy for this sector. Healthcare equipment and services, and
media increased $5.6 billion, or 22 percent, and $3.8 billion, or 25 per-
cent, respectively, of which $2.3 billion and $2.5 billion was attributable to
bridge and/or syndicated loan commitments, most of which are expected
to be distributed in the normal course of executing our “originate to
distribute” strategy. MBNA also contributed to growth in a number of
industries, including healthcare equipment and services, and individuals
and trusts.
Credit protection is purchased to cover the funded portion as well as
the unfunded portion of certain credit exposure. To lessen the cost of
obtaining our desired credit protection levels, credit exposure may be
added within an industry, borrower or counterparty group by selling pro-
tection. Since December 31, 2005, our net credit default protection pur-
chased has been reduced by $6.4 billion reflecting our view of the
underlying risk in our credit portfolio and our near term outlook on the
credit environment.
Bank of America 2006
69