Bank of America 2006 Annual Report Download - page 68
Download and view the complete annual report
Please find page 68 of the 2006 Bank of America annual report below. You can navigate through the pages in the report by either clicking on the pages listed below, or by using the keyword search tool below to find specific information within the annual report.-
 1
1 -
2
-
3
-
4
-
5
-
6
-
7
-
8
-
9
-
10
-
11
-
12
-
13
-
14
-
15
-
16
-
17
-
18
-
19
-
20
-
21
-
22
-
23
-
24
-
25
-
26
-
27
-
28
-
29
-
30
-
31
-
32
-
33
-
34
-
35
-
36
-
37
-
38
-
39
-
40
-
41
-
42
-
43
-
44
-
45
-
46
-
47
-
48
-
49
-
50
-
51
-
52
-
53
-
54
-
55
-
56
-
57
-
 58
58 -
 59
59 -
 60
60 -
 61
61 -
 62
62 -
 63
63 -
 64
64 -
 65
65 -
 66
66 -
 67
67 -
 68
68 -
 69
69 -
 70
70 -
 71
71 -
 72
72 -
 73
73 -
 74
74 -
 75
75 -
 76
76 -
 77
77 -
 78
78 -
79
-
80
-
81
-
82
-
83
-
84
-
85
-
86
-
87
-
88
-
89
-
90
-
91
-
92
-
93
-
94
-
95
-
96
-
97
-
98
-
99
-
100
-
101
-
102
-
103
-
104
-
105
-
106
-
107
-
108
-
109
-
110
-
111
-
112
-
113
-
114
-
115
-
116
-
117
-
118
-
119
-
120
-
121
-
122
-
123
-
124
-
125
-
126
-
127
-
128
-
129
-
130
-
131
-
132
-
133
-
134
-
135
-
136
-
137
-
138
-
139
-
140
-
141
-
142
-
143
-
144
-
145
-
146
-
147
-
148
-
149
-
150
-
151
-
152
-
153
-
154
-
155
 |
 |

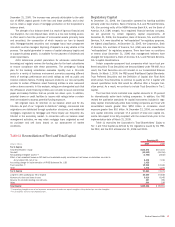
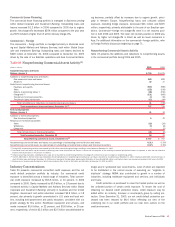
Nonperforming Consumer Assets Activity
Table 14 presents the additions and reductions to nonperforming assets
in the held consumer portfolio during 2006 and 2005. Net additions to
nonperforming loans and leases in 2006 were $245 million compared to
$47 million in 2005. The increase in 2006 was driven by seasoning of the
residential mortgage and home equity portfolios. The nonperforming con-
sumer loans and leases ratio was unchanged compared to 2005 as the
addition of the MBNA portfolio and broad-based loan growth offset the
impact of the increase in nonperforming consumer loan levels.
Table 14 Nonperforming Consumer Assets Activity
(Dollars in millions) 2006 2005
Nonperforming loans and leases
Balance, January 1
$ 785
$ 738
Additions to nonperforming loans and leases:
New nonaccrual loans and leases
1,432
1,108
Reductions in nonperforming loans and leases:
Paydowns and payoffs
(157)
(223)
Sales
(117)
(112)
Returns to performing status
(1)
(698)
(531)
Charge-offs
(2)
(150)
(121)
Transfers to foreclosed properties
(65)
(69)
Transfers to loans held-for-sale
—
(5)
Total net additions to nonperforming loans and leases
245
47
Total nonperforming loans and leases, December 31 (3)
1,030
785
Foreclosed properties
Balance, January 1
61
69
Additions to foreclosed properties:
New foreclosed properties
159
125
Reductions in foreclosed properties:
Sales
(76)
(108)
Writedowns
(85)
(25)
Total net reductions in foreclosed properties
(2)
(8)
Total foreclosed properties, December 31
59
61
Nonperforming consumer assets, December 31 (4)
$1,089
$ 846
Nonperforming consumer loans and leases as a percentage of outstanding consumer loans and leases
0.22%
0.22%
Nonperforming consumer assets as a percentage of outstanding consumer loans, leases and foreclosed properties
0.23%
0.24%
(1) Consumer loans and leases are generally returned to performing status when principal or interest is less than 90 days past due.
(2) Our policy is not to classify consumer credit card and consumer non-real estate loans and leases as nonperforming; therefore, the charge-offs on these loans have no impact on nonperforming activity.
(3) In 2006, $69 million in Interest Income was estimated to be contractually due on nonperforming consumer loans and leases classified as nonperforming at December 31, 2006 of which $17 million was received and included
in Net Income for 2006.
(4) Balances do not include nonperforming loans held for sale included in Other Assets of $30 million and $24 million at December 31, 2006 and 2005.
Commercial Portfolio Credit Risk Management
Credit risk management for the commercial portfolio begins with an
assessment of the credit risk profile of the borrower or counterparty based
on an analysis of the financial position of a borrower or counterparty. As
part of the overall credit risk assessment of a borrower or counterparty,
most of our commercial credit exposure or transactions are assigned a
risk rating and are subject to approval based on defined credit approval
standards. Subsequent to loan origination, risk ratings are monitored on
an ongoing basis. If necessary, risk ratings are adjusted to reflect changes
in the financial condition, cash flow or financial situation of a borrower or
counterparty. We use risk rating aggregations to measure and evaluate
concentrations within portfolios. Risk ratings are a factor in determining
the level of assigned economic capital and the allowance for credit losses.
In making credit decisions, we consider risk rating, collateral, country,
industry and single name concentration limits while also balancing the
total borrower or counterparty relationship and SVA. Our lines of business
and Risk Management personnel use a variety of tools to continuously
monitor the ability of a borrower or counterparty to perform under its
obligations.
For information on our accounting policies regarding delinquencies,
nonperforming status and charge-offs for the commercial portfolio, see
Note 1 of the Consolidated Financial Statements.
Management of Commercial Credit Risk
Concentrations
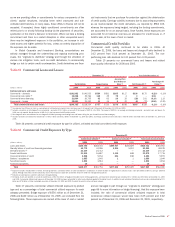
Portfolio credit risk is evaluated and managed with a goal that concen-
trations of credit exposure do not result in undesirable levels of risk. We
review, measure, and manage concentrations of credit exposure by
industry, product, geography and customer relationship. Distribution of
loans and leases by loan size is an additional measure of the portfolio risk
diversification. We also review, measure, and manage commercial real
estate loans by geographic location and property type. In addition, within
our international portfolio, we evaluate borrowings by region and by coun-
try. Tables 18 and 20 and Tables 23 through 25 summarize these concen-
trations. Additionally, we utilize syndication of exposure to third parties,
loan sales and other risk mitigation techniques to manage the size and
risk profile of the loan portfolio.
From the perspective of portfolio risk management, customer concen-
tration management is most relevant in Global Corporate and Investment
Banking. Within that segment’s Business Lending and Capital Markets and
Advisory Services businesses, we facilitate bridge financing to fund acquis-
itions and other short-term needs as well as provide syndicated financing
for our clients. These concentrations are managed in part through our
established “originate to distribute” strategy. These client transactions are
sometimes large and leveraged. They can also have a higher degree of risk
66
Bank of America 2006