Bank of America 2006 Annual Report Download - page 2
Download and view the complete annual report
Please find page 2 of the 2006 Bank of America annual report below. You can navigate through the pages in the report by either clicking on the pages listed below, or by using the keyword search tool below to find specific information within the annual report.-
 1
1 -
 2
2 -
 3
3 -
 4
4 -
 5
5 -
 6
6 -
 7
7 -
 8
8 -
 9
9 -
 10
10 -
 11
11 -
 12
12 -
 13
13 -
14
-
15
-
16
-
17
-
18
-
19
-
20
-
21
-
22
-
23
-
24
-
25
-
26
-
27
-
28
-
29
-
30
-
31
-
32
-
33
-
34
-
35
-
36
-
37
-
38
-
39
-
40
-
41
-
42
-
43
-
44
-
45
-
46
-
47
-
48
-
49
-
50
-
51
-
52
-
53
-
54
-
55
-
56
-
57
-
58
-
59
-
60
-
61
-
62
-
63
-
64
-
65
-
66
-
67
-
68
-
69
-
70
-
71
-
72
-
73
-
74
-
75
-
76
-
77
-
78
-
79
-
80
-
81
-
82
-
83
-
84
-
85
-
86
-
87
-
88
-
89
-
90
-
91
-
92
-
93
-
94
-
95
-
96
-
97
-
98
-
99
-
100
-
101
-
102
-
103
-
104
-
105
-
106
-
107
-
108
-
109
-
110
-
111
-
112
-
113
-
114
-
115
-
116
-
117
-
118
-
119
-
120
-
121
-
122
-
123
-
124
-
125
-
126
-
127
-
128
-
129
-
130
-
131
-
132
-
133
-
134
-
135
-
136
-
137
-
138
-
139
-
140
-
141
-
142
-
143
-
144
-
145
-
146
-
147
-
148
-
149
-
150
-
151
-
152
-
153
-
154
-
155
 |
 |

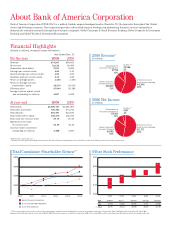
Global Consumer &
Small Business Banking
$11,171
53%
All Other**
$767
4%
Global Corporate &
Investment Banking
$6,792
32%
Global Consumer &
Small Business Banking
$41,691
56%
All Other**
$2,086
3%
Global Wealth &
Investment Management
$7,779
10%
Global Corporate &
Investment Banking
$22,691
31%
Bank of America Corporation (NYSE: BAC) is a publicly traded company headquartered in Charlotte, NC, that operates throughout the United
States and 44 foreign countries. The corporation provides a diversified range of banking and nonbanking financial services and products
domestically and internationally through three business segments: Global Consumer & Small Business Banking, Global Corporate & Investment
Banking and Global Wealth & Investment Management.
For the year 2006 2005
Revenue* $74,247 $56,923
Net income 21,133 16,465
Shareholder value added 9,121 6,594
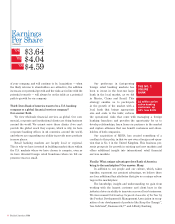
Earnings per common share 4.66 4.10
Diluted earnings per common share 4.59 4.04
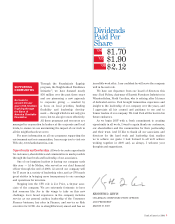
Dividends paid per common share 2.12 1.90
Return on average assets 1.44 % 1.30 %
Return on average common
shareholders’ equity 16.27 % 16.51 %
Efficiency ratio* 47.94 % 50.38 %
Average common shares issued
and outstanding (in millions) 4,527 4,009
At year end 2006 2005
Total assets $1,459,737 $1,291,803
Total loans and leases 706,490 573,791
Total deposits 693,497 634,670
Total shareholders’ equity 135,272 101,533
Book value per common share 29.70 25.32
Market price per share
of common stock 53.39 46.15
Common shares issued and
outstanding (in millions) 4,458 4,000
*Fully taxable-equivalent basis
**All Other consists primarily of Equity Investments and Other. For more information, refer to All Other section in the Management’s Discussion and Analysis.
Financial Highlights
(Dollars in millions, except per share information)
About Bank of America Corporation
2006 Revenue*
(in millions)
2006 Net Income
(in millions)
Year Ended Dec. 31
Global Wealth &
Investment Management
$2,403
11%
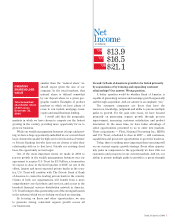
$20
$30
$40
$50
High $38.45 $41.77 $47.44 $47.08 $54.90
Low 27.08 32.82 38.96 41.57 43.09
Close 34.79 40.22 46.99 46.15 53.39
$60
Total Cumulative Shareholder Return***
Bank of America Corporation
S & P 500 CM BANK INDUSTRY
S & P 500 COMP-LTD
5-Year Stock Performance
2001 2002 2003 2004 2005 2006
$100
$150
$200
$250
***The graph compares the yearly change in the corporation’s cumulative total stockholders’ return on its common stock with (i) Standard & Poor’s 500 Index and (ii) Standard & Poor’s 500
Commercial Banks Index for the years ended 2002 to 2006. The graph assumes an initial investment of $100 at the end of 2001 and the reinvestment of all dividends during the periods indicated.
2002 2003 2004 2005 2006