Bank of America 2006 Annual Report Download - page 3
Download and view the complete annual report
Please find page 3 of the 2006 Bank of America annual report below. You can navigate through the pages in the report by either clicking on the pages listed below, or by using the keyword search tool below to find specific information within the annual report.-
 1
1 -
 2
2 -
 3
3 -
 4
4 -
 5
5 -
 6
6 -
 7
7 -
 8
8 -
 9
9 -
 10
10 -
 11
11 -
 12
12 -
 13
13 -
 14
14 -
15
-
16
-
17
-
18
-
19
-
20
-
21
-
22
-
23
-
24
-
25
-
26
-
27
-
28
-
29
-
30
-
31
-
32
-
33
-
34
-
35
-
36
-
37
-
38
-
39
-
40
-
41
-
42
-
43
-
44
-
45
-
46
-
47
-
48
-
49
-
50
-
51
-
52
-
53
-
54
-
55
-
56
-
57
-
58
-
59
-
60
-
61
-
62
-
63
-
64
-
65
-
66
-
67
-
68
-
69
-
70
-
71
-
72
-
73
-
74
-
75
-
76
-
77
-
78
-
79
-
80
-
81
-
82
-
83
-
84
-
85
-
86
-
87
-
88
-
89
-
90
-
91
-
92
-
93
-
94
-
95
-
96
-
97
-
98
-
99
-
100
-
101
-
102
-
103
-
104
-
105
-
106
-
107
-
108
-
109
-
110
-
111
-
112
-
113
-
114
-
115
-
116
-
117
-
118
-
119
-
120
-
121
-
122
-
123
-
124
-
125
-
126
-
127
-
128
-
129
-
130
-
131
-
132
-
133
-
134
-
135
-
136
-
137
-
138
-
139
-
140
-
141
-
142
-
143
-
144
-
145
-
146
-
147
-
148
-
149
-
150
-
151
-
152
-
153
-
154
-
155
 |
 |
Letter to Shareholders ......................................................... 2
Building Opportunities ...................................................... 10
How We’re Growing .............................................................16
Helping More People Own Homes ................................... 18
Winning Over Small Businesses .....................................20
Managing Monster Cash Flows ...................................... 22
Serving the Needs of Big Investors ................................24
Global Consumer & Small
Business Banking serves
approximately 53 million
consumer households through
checking, savings, credit and
debit cards, home equity
lending and mortgages. We
also serve mass-market small
businesses with capital, credit,
deposit and payment services.
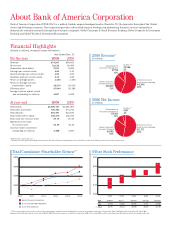
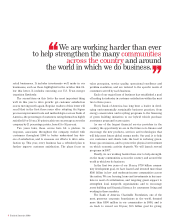
GLOBAL CONSUMER & SMALL BUSINESS BANKING
BUSINESSES
Deposits
Card Services
Mortgage
Home Equity
Contents
Our Lines of Business
Card Services
50%
Mortgage
3%
Net Income**
Home Equity
5%
Deposits
44%
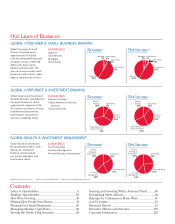
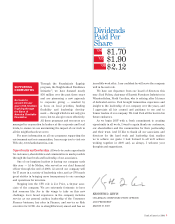
Premier
Banking &
Investments
39%
The Private Bank
23%
ALM†/Other
24%
Columbia
Management
14%
Net Income
Premier
Banking &
Investments
37%
ALM†/Other
16%
The Private Bank
27%
Columbia
Management
20%
Revenue*
Banking and Investing With a Personal Touch...........26
Revitalizing Sweet Auburn...................................................28
Helping Our Customers in Many Ways .........................30
Join Us Online ...................................................................... 32
Financial Review ................................................................. 33
Executive Offi cers and Directors ...................................151
Corporate Information ..................................................... 152
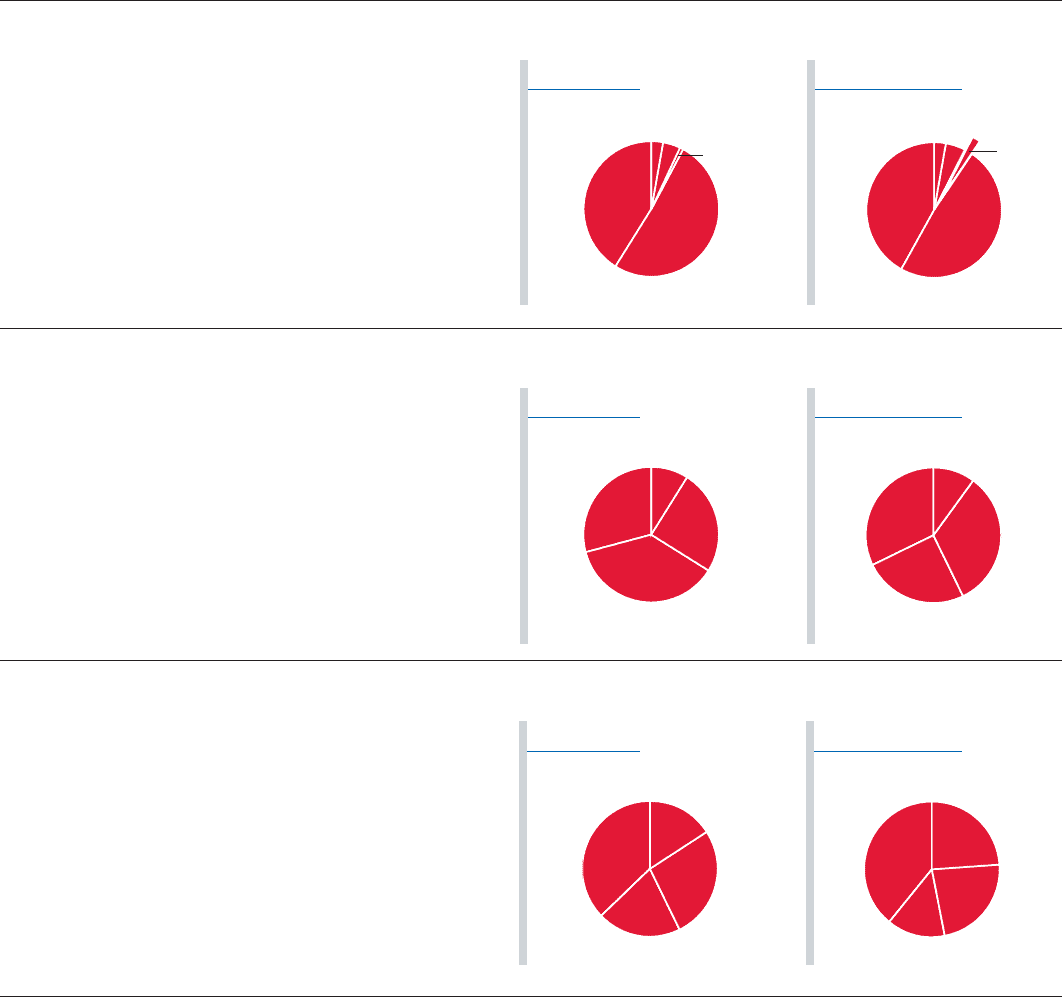
Treasury
Services
29%
ALM†/Other
9%
Business
Lending
25%
Capital Markets &
Advisory Services
37%
Revenue*
Global Wealth & Investment
Management provides a wide
offering of customized
banking and investment
services for individual and
institutional clients.
Treasury
Services
32%
ALM†/Other
10%
Business
Lending
33%
Capital Markets &
Advisory Services
25%
Net Income
GLOBAL WEALTH & INVESTMENT MANAGEMENT
BUSINESSES
The Private Bank
Columbia Management
Premier Banking & Investments™
Global Corporate & Investment
Banking provides comprehensive
financial solutions to clients
ranging from companies with
$2.5 million in revenues to large
multinational corporations,
governments, insti tutional
investors and hedge funds.
GLOBAL CORPORATE & INVESTMENT BANKING
BUSINESSES
Business Lending
Capital Markets & Advisory
Services
Treasur y Services
Revenue*
Card Services
51%
Deposits
41%
Mortgage
3%
Home Equity
4% ALM†/Other
1%
*Fully taxable-equivalent basis **Reflects net loss in ALM/Other †ALM=Asset and Liability Management
ALM†/Other
−2%