Bank of America 2006 Annual Report Download - page 47
Download and view the complete annual report
Please find page 47 of the 2006 Bank of America annual report below. You can navigate through the pages in the report by either clicking on the pages listed below, or by using the keyword search tool below to find specific information within the annual report.-
 1
1 -
2
-
3
-
4
-
5
-
6
-
7
-
8
-
9
-
10
-
11
-
12
-
13
-
14
-
15
-
16
-
17
-
18
-
19
-
20
-
21
-
22
-
23
-
24
-
25
-
26
-
27
-
28
-
29
-
30
-
31
-
32
-
33
-
34
-
35
-
36
-
 37
37 -
 38
38 -
 39
39 -
 40
40 -
 41
41 -
 42
42 -
 43
43 -
 44
44 -
 45
45 -
 46
46 -
 47
47 -
 48
48 -
 49
49 -
 50
50 -
 51
51 -
 52
52 -
 53
53 -
 54
54 -
 55
55 -
 56
56 -
 57
57 -
58
-
59
-
60
-
61
-
62
-
63
-
64
-
65
-
66
-
67
-
68
-
69
-
70
-
71
-
72
-
73
-
74
-
75
-
76
-
77
-
78
-
79
-
80
-
81
-
82
-
83
-
84
-
85
-
86
-
87
-
88
-
89
-
90
-
91
-
92
-
93
-
94
-
95
-
96
-
97
-
98
-
99
-
100
-
101
-
102
-
103
-
104
-
105
-
106
-
107
-
108
-
109
-
110
-
111
-
112
-
113
-
114
-
115
-
116
-
117
-
118
-
119
-
120
-
121
-
122
-
123
-
124
-
125
-
126
-
127
-
128
-
129
-
130
-
131
-
132
-
133
-
134
-
135
-
136
-
137
-
138
-
139
-
140
-
141
-
142
-
143
-
144
-
145
-
146
-
147
-
148
-
149
-
150
-
151
-
152
-
153
-
154
-
155
 |
 |

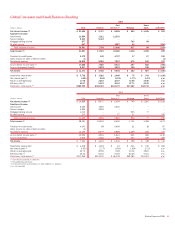
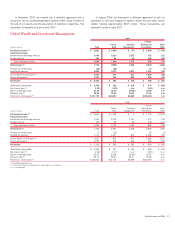
Global Consumer and Small Business Banking
2006
(Dollars in millions) Total Deposits
Card
Services
(1)
Mortgage
Home
Equity ALM/Other
Net interest income (2)
$ 21,100 $ 9,767 $ 8,805 $ 599 $ 1,406 $ 523
Noninterest income
Card income
13,504 1,911 11,593
–– –
Service charges
5,343 5,343
––– –
Mortgage banking income
877
––
793 84
–
All other income
867
–
1,087 44
–
(264)
Total noninterest income
20,591 7,254 12,680 837 84 (264)
Total revenue (2)
41,691 17,021 21,485 1,436 1,490 259
Provision for credit losses
5,172 165 4,727 17 47 216
Gains (losses) on sales of debt securities
(1)
––––
(1)
Noninterest expense
18,830 9,053 7,827 972 641 337
Income before income taxes
(2)
17,688 7,803 8,931 447 802 (295)
Income tax expense (benefit)
6,517 2,875 3,291 165 295 (109)
Net income
$ 11,171 $ 4,928 $ 5,640 $ 282 $ 507 $ (186)
Shareholder value added
$ 5,738 $ 3,610 $ 1,908 $ 75 $ 343 $ (198)
Net interest yield
(2)
6.42% 2.94% 8.93% 1.77% 2.47% n/m
Return on average equity
17.70 32.53 12.67 14.95 33.96 n/m
Efficiency ratio
(2)
45.17 53.19 36.43 67.71 43.01 n/m
Period end – total assets
(3)
$382,392 $342,443 $143,179 $37,282 $63,742 n/m
2005
(Dollars in millions) Total Deposits
Card
Services
(1)
Mortgage
Home
Equity ALM/Other
Net interest income (2) $ 16,898 $ 8,537 $ 5,009 $ 745 $ 1,291 $1,316
Noninterest income
Card income 5,084 1,560 3,524 – – –
Service charges 4,996 4,996 – – – –
Mortgage banking income 1,012 – – 935 77 –
All other income 333 – 57 21 – 255
Total noninterest income 11,425 6,556 3,581 956 77 255
Total revenue (2) 28,323 15,093 8,590 1,701 1,368 1,571
Provision for credit losses 4,243 98 3,999 21 38 87
Gains (losses) on sales of debt securities (2) – – – – (2)
Noninterest expense 13,124 8,079 2,968 1,059 646 372
Income before income taxes
(2)
10,954 6,916 1,623 621 684 1,110
Income tax expense 3,933 2,484 582 223 246 398
Net income $ 7,021 $ 4,432 $ 1,041 $ 398 $ 438 $ 712
Shareholder value added $ 4,318 $ 3,118 $ 21 $ 212 $ 315 $ 652
Net interest yield
(2)
5.65% 2.77% 8.90% 1.99% 2.71% n/m
Return on average equity 23.73 29.56 9.28 23.12 39.20 n/m
Efficiency ratio
(2)
46.34 53.52 34.55 62.26 47.24 n/m
Period end – total assets
(3)
$331,259 $321,030 $ 66,338 $42,183 $51,401 n/m
(1) Card Services presented on a held view.
(2) Fully taxable-equivalent basis
(3) Total Assets include asset allocations to match liabilities (i.e., deposits).
n/m = not meaningful
Bank of America 2006
45