Bank of America 2006 Annual Report Download - page 149
Download and view the complete annual report
Please find page 149 of the 2006 Bank of America annual report below. You can navigate through the pages in the report by either clicking on the pages listed below, or by using the keyword search tool below to find specific information within the annual report.-
 1
1 -
2
-
3
-
4
-
5
-
6
-
7
-
8
-
9
-
10
-
11
-
12
-
13
-
14
-
15
-
16
-
17
-
18
-
19
-
20
-
21
-
22
-
23
-
24
-
25
-
26
-
27
-
28
-
29
-
30
-
31
-
32
-
33
-
34
-
35
-
36
-
37
-
38
-
39
-
40
-
41
-
42
-
43
-
44
-
45
-
46
-
47
-
48
-
49
-
50
-
51
-
52
-
53
-
54
-
55
-
56
-
57
-
58
-
59
-
60
-
61
-
62
-
63
-
64
-
65
-
66
-
67
-
68
-
69
-
70
-
71
-
72
-
73
-
74
-
75
-
76
-
77
-
78
-
79
-
80
-
81
-
82
-
83
-
84
-
85
-
86
-
87
-
88
-
89
-
90
-
91
-
92
-
93
-
94
-
95
-
96
-
97
-
98
-
99
-
100
-
101
-
102
-
103
-
104
-
105
-
106
-
107
-
108
-
109
-
110
-
111
-
112
-
113
-
114
-
115
-
116
-
117
-
118
-
119
-
120
-
121
-
122
-
123
-
124
-
125
-
126
-
127
-
128
-
129
-
130
-
131
-
132
-
133
-
134
-
135
-
136
-
137
-
138
-
 139
139 -
 140
140 -
 141
141 -
 142
142 -
 143
143 -
 144
144 -
 145
145 -
 146
146 -
 147
147 -
 148
148 -
 149
149 -
 150
150 -
 151
151 -
 152
152 -
 153
153 -
 154
154 -
 155
155
 |
 |

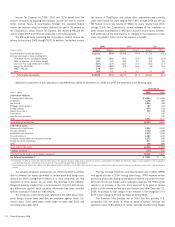
The following tables present reconciliations of the three business segments’ Total Revenue on a FTE basis and Net Income to the Consolidated State-
ment of Income, and Total Assets to the Consolidated Balance Sheet. The adjustments presented in the table below include consolidated income and
expense amounts not specifically allocated to individual business segments.
Year Ended December 31
(Dollars in millions) 2006 2005 2004
Segments’ total revenue (FTE basis)
$72,161
$56,239 $49,377
Adjustments:
ALM activities
(1)
(441)
(501) 20
Equity investment gains
2,866
1,964 911
Liquidating businesses
267
214 282
FTE basis adjustment
(1,224)
(832) (717)
Other
(606)
(993) (908)
Consolidated revenue
$73,023
$56,091 $48,965
Segments’ net income
$20,366
$15,721 $13,315
Adjustments, net of taxes:
ALM activities
(1, 2, 3)
(816)
52 869
Equity investment gains
1,806
1,257 583
Liquidating businesses
139
109 78
Merger and restructuring charges
(507)
(275) (411)
Other
145
(399) (487)
Consolidated net income
$21,133
$16,465 $13,947
(1) Includes Revenue associated with derivative instruments which did not qualify for SFAS 133 hedge accounting treatment of $(675) million and $86 million in 2005 and 2004.
(2) Includes Net Income associated with derivative instruments which did not qualify for SFAS 133 hedge accounting treatment of $(421) million and $(196) million in 2005 and 2004.
(3) Includes pre-tax Gains (Losses) on Sales of Debt Securities of $(494) million, $820 million and $1,613 million in 2006, 2005 and 2004, respectively.
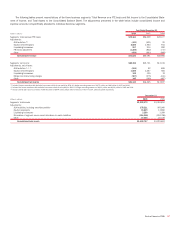
December 31
(Dollars in millions) 2006 2005
Segments’ total assets
$1,209,379
$1,093,853
Adjustments:
ALM activities, including securities portfolio
378,211
365,060
Equity investments
15,639
13,960
Liquidating businesses
3,280
3,399
Elimination of segment excess asset allocations to match liabilities
(166,618)
(204,788)
Other
19,846
20,319
Consolidated total assets
$1,459,737
$1,291,803
Bank of America 2006
147