Bank of America 2006 Annual Report Download - page 150
Download and view the complete annual report
Please find page 150 of the 2006 Bank of America annual report below. You can navigate through the pages in the report by either clicking on the pages listed below, or by using the keyword search tool below to find specific information within the annual report.-
 1
1 -
2
-
3
-
4
-
5
-
6
-
7
-
8
-
9
-
10
-
11
-
12
-
13
-
14
-
15
-
16
-
17
-
18
-
19
-
20
-
21
-
22
-
23
-
24
-
25
-
26
-
27
-
28
-
29
-
30
-
31
-
32
-
33
-
34
-
35
-
36
-
37
-
38
-
39
-
40
-
41
-
42
-
43
-
44
-
45
-
46
-
47
-
48
-
49
-
50
-
51
-
52
-
53
-
54
-
55
-
56
-
57
-
58
-
59
-
60
-
61
-
62
-
63
-
64
-
65
-
66
-
67
-
68
-
69
-
70
-
71
-
72
-
73
-
74
-
75
-
76
-
77
-
78
-
79
-
80
-
81
-
82
-
83
-
84
-
85
-
86
-
87
-
88
-
89
-
90
-
91
-
92
-
93
-
94
-
95
-
96
-
97
-
98
-
99
-
100
-
101
-
102
-
103
-
104
-
105
-
106
-
107
-
108
-
109
-
110
-
111
-
112
-
113
-
114
-
115
-
116
-
117
-
118
-
119
-
120
-
121
-
122
-
123
-
124
-
125
-
126
-
127
-
128
-
129
-
130
-
131
-
132
-
133
-
134
-
135
-
136
-
137
-
138
-
139
-
 140
140 -
 141
141 -
 142
142 -
 143
143 -
 144
144 -
 145
145 -
 146
146 -
 147
147 -
 148
148 -
 149
149 -
 150
150 -
 151
151 -
 152
152 -
 153
153 -
 154
154 -
 155
155
 |
 |

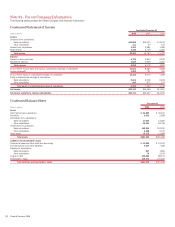
Note 21 – Parent Company Information
The following tables present the Parent Company Only financial information:
Condensed Statement of Income
Year Ended December 31
(Dollars in millions) 2006 2005 2004
Income
Dividends from subsidiaries:
Bank subsidiaries
$15,950
$10,400 $ 8,100
Other subsidiaries
111
63 133
Interest from subsidiaries
3,944
2,581 1,085
Other income
2,346
1,719 2,463
Total income
22,351
14,763 11,781
Expense
Interest on borrowed funds
5,799
3,843 2,876
Noninterest expense
3,019
2,636 2,057
Total expense
8,818
6,479 4,933
Income before income taxes and equity in undistributed earnings of subsidiaries
13,533
8,284 6,848
Income tax benefit
1,002
791 360
Income before equity in undistributed earnings of subsidiaries
14,535
9,075 7,208
Equity in undistributed earnings of subsidiaries:
Bank subsidiaries
5,613
6,518 6,165
Other subsidiaries
985
872 574
Total equity in undistributed earnings of subsidiaries
6,598
7,390 6,739
Net income
$21,133
$16,465 $13,947
Net income available to common shareholders
$21,111
$16,447 $13,931
Condensed Balance Sheet
December 31
(Dollars in millions) 2006 2005
Assets
Cash held at bank subsidiaries
$ 54,989
$ 49,670
Securities
2,932
2,285
Receivables from subsidiaries:
Bank subsidiaries
17,063
14,581
Other subsidiaries
20,661
18,766
Investments in subsidiaries:
Bank subsidiaries
162,291
119,210
Other subsidiaries
6,488
2,472
Other assets
19,118
13,685
Total assets
$283,542
$220,669
Liabilities and shareholders’ equity
Commercial paper and other short-term borrowings
$ 31,852
$ 19,333
Accrued expenses and other liabilities
9,929
7,228
Payables to subsidiaries:
Bank subsidiaries
857
1,824
Other subsidiaries
76
2,479
Long-term debt
105,556
88,272
Shareholders’ equity
135,272
101,533
Total liabilities and shareholders’ equity
$283,542
$220,669
148
Bank of America 2006