Bank of America 2006 Annual Report Download - page 79
Download and view the complete annual report
Please find page 79 of the 2006 Bank of America annual report below. You can navigate through the pages in the report by either clicking on the pages listed below, or by using the keyword search tool below to find specific information within the annual report.-
 1
1 -
2
-
3
-
4
-
5
-
6
-
7
-
8
-
9
-
10
-
11
-
12
-
13
-
14
-
15
-
16
-
17
-
18
-
19
-
20
-
21
-
22
-
23
-
24
-
25
-
26
-
27
-
28
-
29
-
30
-
31
-
32
-
33
-
34
-
35
-
36
-
37
-
38
-
39
-
40
-
41
-
42
-
43
-
44
-
45
-
46
-
47
-
48
-
49
-
50
-
51
-
52
-
53
-
54
-
55
-
56
-
57
-
58
-
59
-
60
-
61
-
62
-
63
-
64
-
65
-
66
-
67
-
68
-
 69
69 -
 70
70 -
 71
71 -
 72
72 -
 73
73 -
 74
74 -
 75
75 -
 76
76 -
 77
77 -
 78
78 -
 79
79 -
 80
80 -
 81
81 -
 82
82 -
 83
83 -
 84
84 -
 85
85 -
 86
86 -
 87
87 -
 88
88 -
 89
89 -
90
-
91
-
92
-
93
-
94
-
95
-
96
-
97
-
98
-
99
-
100
-
101
-
102
-
103
-
104
-
105
-
106
-
107
-
108
-
109
-
110
-
111
-
112
-
113
-
114
-
115
-
116
-
117
-
118
-
119
-
120
-
121
-
122
-
123
-
124
-
125
-
126
-
127
-
128
-
129
-
130
-
131
-
132
-
133
-
134
-
135
-
136
-
137
-
138
-
139
-
140
-
141
-
142
-
143
-
144
-
145
-
146
-
147
-
148
-
149
-
150
-
151
-
152
-
153
-
154
-
155
 |
 |

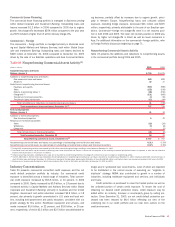
The following graph shows daily trading-related revenue and VAR for 2006.
Trading Risk and Return
Daily Trading-related Revenue and VAR
-100
-80
-60
-40
-20
0
20
40
60
80
100
12/31/05 3/31/06 6/30/06 9/30/06 12/31/06
(Dollars in Millions)
Daily
Trading -
related
Revenue
VA R
Table 28 presents average, high and low daily VAR for the twelve months ended December 31, 2006 and 2005.
Table 28 Trading Activities Market Risk
Twelve Months Ended December 31
2006 2005
VAR VAR
(Dollars in millions) Average High
(1)
Low
(1)
Average High
(1)
Low
(1)
Foreign exchange $ 8.2 $22.9 $ 3.1 $ 5.6 $12.1 $ 2.6
Interest rate 18.5 50.0 7.3 24.7 58.2 10.8
Credit 26.8 36.7 18.4 22.7 33.4 14.4
Real estate/mortgage 8.4 12.7 4.7 11.4 20.7 6.5
Equities 18.8 39.6 9.9 18.1 35.1 9.6
Commodities 6.1 9.9 3.4 6.6 10.6 3.5
Portfolio diversification (45.5) – – (47.3) – –
Total market-based trading portfolio (2) $ 41.3 $59.8 $26.0 $ 41.8 $67.0 $26.8
(1) The high and low for the total portfolio may not equal the sum of the individual components as the highs or lows of the individual portfolios may have occurred on different trading days.
(2) See Commercial Portfolio Credit Risk Management on page 66 for a discussion of the VAR related to the credit derivatives that economically hedge the loan portfolio.
Stress Testing
Because the very nature of a VAR model suggests results can exceed our
estimates, we also “stress test” our portfolio. Stress testing estimates
the value change in our trading portfolio that may result from abnormal
market movements. Various types of stress tests are run regularly against
the overall trading portfolio and individual businesses. Historical scenarios
simulate the impact of price changes which occurred during a set of
extended historical market events. The results of these scenarios are
reported daily to senior management. During 2006, the largest losses
among these scenarios ranged from $7 million to $591 million. Hypo-
thetical scenarios evaluate the potential impact of extreme but plausible
events. These scenarios are developed to address perceived vulner-
abilities in the market and in our portfolios, and are periodically updated.
Senior management reviews and evaluates results of these scenarios
monthly. During 2006, the largest losses among these scenarios ranged
from $441 million to $734 million. Worst-case losses, which represent the
most extreme losses in our daily VAR calculation, are reported daily.
Finally, desk-level stress tests are performed daily for individual busi-
nesses. These stress tests evaluate the potential adverse impact of large
moves in the market risk factors to which those businesses are most
sensitive.
Interest Rate Risk Management for Nontrading
Activities
Interest rate risk represents the most significant market risk exposure to
our nontrading exposures. Our overall goal is to manage interest rate risk
so that movements in interest rates do not adversely affect core net inter-
est income – managed basis. Interest rate risk is measured as the poten-
tial volatility in our core net interest income – managed basis caused by
changes in market interest rates. Client facing activities, primarily lending
and deposit-taking, create interest rate sensitive positions on our balance
sheet. Interest rate risk from these activities, as well as the impact of
changing market conditions, is managed through our ALM activities.
Simulations are used to estimate the impact on core net interest
income – managed basis using numerous interest rate scenarios, balance
sheet trends and strategies. These simulations evaluate how the above
Bank of America 2006
77