Bank of America 2006 Annual Report Download - page 67
Download and view the complete annual report
Please find page 67 of the 2006 Bank of America annual report below. You can navigate through the pages in the report by either clicking on the pages listed below, or by using the keyword search tool below to find specific information within the annual report.-
 1
1 -
2
-
3
-
4
-
5
-
6
-
7
-
8
-
9
-
10
-
11
-
12
-
13
-
14
-
15
-
16
-
17
-
18
-
19
-
20
-
21
-
22
-
23
-
24
-
25
-
26
-
27
-
28
-
29
-
30
-
31
-
32
-
33
-
34
-
35
-
36
-
37
-
38
-
39
-
40
-
41
-
42
-
43
-
44
-
45
-
46
-
47
-
48
-
49
-
50
-
51
-
52
-
53
-
54
-
55
-
56
-
 57
57 -
 58
58 -
 59
59 -
 60
60 -
 61
61 -
 62
62 -
 63
63 -
 64
64 -
 65
65 -
 66
66 -
 67
67 -
 68
68 -
 69
69 -
 70
70 -
 71
71 -
 72
72 -
 73
73 -
 74
74 -
 75
75 -
 76
76 -
 77
77 -
78
-
79
-
80
-
81
-
82
-
83
-
84
-
85
-
86
-
87
-
88
-
89
-
90
-
91
-
92
-
93
-
94
-
95
-
96
-
97
-
98
-
99
-
100
-
101
-
102
-
103
-
104
-
105
-
106
-
107
-
108
-
109
-
110
-
111
-
112
-
113
-
114
-
115
-
116
-
117
-
118
-
119
-
120
-
121
-
122
-
123
-
124
-
125
-
126
-
127
-
128
-
129
-
130
-
131
-
132
-
133
-
134
-
135
-
136
-
137
-
138
-
139
-
140
-
141
-
142
-
143
-
144
-
145
-
146
-
147
-
148
-
149
-
150
-
151
-
152
-
153
-
154
-
155
 |
 |

credit card portfolio experienced increasing net charge-off and managed
net loss trends throughout the year resulting from seasoning of the Euro-
pean portfolio and higher personal insolvencies in the United Kingdom.
See below for a discussion of the impact of SOP 03-3 on the MBNA
portfolio.
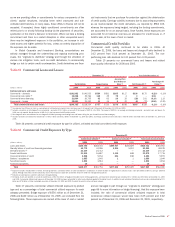
Home Equity Lines
At December 31, 2006, approximately 73 percent of the managed home
equity portfolio was included in Global Consumer and Small Business
Banking, while the remainder of the portfolio is in Global Wealth and
Investment Management. This portfolio consists of revolving first and
second lien residential mortgage lines of credit. On a held basis, out-
standing home equity lines increased $12.8 billion, or 21 percent, in
2006 compared to 2005 due to enhanced product offerings and the
expanding home equity market. Nonperforming home equity lines
increased $132 million in 2006 due to portfolio seasoning.
Direct/Indirect Consumer
At December 31, 2006, approximately 49 percent of the managed direct/
indirect portfolio was included in Business Lending within Global Corporate
and Investment Banking (automotive, marine, motorcycle and recreational
vehicle loans); 41 percent was included in Global Consumer and Small
Business Banking (home equity loans, student and other non-real estate
secured and unsecured personal loans) and the remainder was included in
Global Wealth and Investment Management (home equity loans and other
non-real estate secured and unsecured personal loans) and All Other
(home equity loans).
On a held basis, outstanding loans and leases increased $22.7 bil-
lion in 2006 compared to 2005 due to the addition of the MBNA portfolio,
purchases of retail automotive loans and reduced securitization activity.
Loans past due 90 days or more and still accruing interest increased
$272 million due to the addition of MBNA and growth in the portfolio. Net
charge-offs increased $276 million to 0.88 percent (1.01 percent exclud-
ing the impact of SOP 03-3) of total average held direct/indirect loans,
driven by the addition of the MBNA unsecured lending portfolio and
seasoning of the automotive loan portfolio. Card Services unsecured lend-
ing portfolio charge-offs increased throughout 2006 as charge-offs trended
toward more normalized loss levels post bankruptcy reform. Portfolio
seasoning and reduced securitization activity also contributed to the
increasing charge-off trend.
Net losses for the managed loan portfolio increased $591 million to
1.23 percent of total average managed direct/indirect loans compared to
0.53 percent in 2005, primarily due to the addition of MBNA. See below
for a discussion of the impact of SOP 03-3 on the MBNA portfolio.
Other Consumer
At December 31, 2006, approximately 67 percent of the other consumer
portfolio consists of the foreign consumer loan portfolio which was
included in Card Services within Global Consumer and Small Business
Banking and in ALM/Other within Global Corporate and Investment Bank-
ing. The remainder of the portfolio was associated with our previously
exited consumer finance businesses and was included in All Other. Other
consumer outstanding loans and leases increased $2.5 billion at
December 31, 2006 compared to December 31, 2005 driven primarily by
the addition of the MBNA portfolio. Net charge-offs as a percentage of
total average other consumer loans declined by 116 bps due primarily to
growth in the foreign portfolio from the MBNA acquisition. See below for a
discussion of the impact of SOP 03-3 on the MBNA portfolio.
SOP 03-3
SOP 03-3 addresses accounting for differences between contractual cash
flows and cash flows expected to be collected from an investor’s initial
investment in loans acquired in a transfer if those differences are attribut-
able, at least in part, to credit quality. SOP 03-3 requires impaired loans
be recorded at fair value and prohibits “carrying over” or the creation of
valuation allowances in the initial accounting of loans acquired in a trans-
fer that are within the scope of this SOP (categories of loans for which it is
probable, at the time of acquisition, that all amounts due according to the
contractual terms of the loan agreement will not be collected). The prohib-
ition of the valuation allowance carryover applies to the purchase of an
individual loan, a pool of loans, a group of loans, and loans acquired in a
purchase business combination.
In accordance with SOP 03-3, certain acquired loans of MBNA that
were considered impaired were written down to fair value at the acquisition
date. Therefore, reported net charge-offs and managed net losses were
lower since these impaired loans that would have been charged off during
the period were reduced to fair value as of the acquisition date. SOP 03-3
does not apply to the acquired loans that have been securitized as they
are not held on the Corporation’s Balance Sheet.
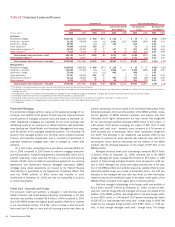
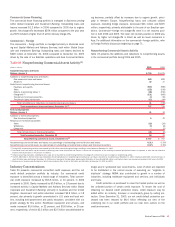
Consumer net charge-offs, managed net losses, and associated
ratios as reported and excluding the impact of SOP 03-3 for 2006 are
presented in Table 13. Management believes that excluding the impact of
SOP 03-3 provides a more accurate reflection of portfolio credit quality.
Table 13 Consumer Net Charge-offs and Managed Net Losses (Excluding the Impact of SOP 03-3)
2006
As Reported Excluding Impact
(1)
Held Managed Held Managed
(Dollars in millions) Amount Percent Amount Percent Amount Percent Amount Percent
Residential mortgage $ 39 0.02% $ 39 0.02% $ 39 0.02% $ 39 0.02%
Credit card – domestic 3,094 4.85 5,395 3.89 3,193 5.00 5,494 3.96
Credit card – foreign 225 2.46 980 3.95 278 3.05 1,033 4.17
Home equity lines 51 0.07 51 0.07 51 0.07 51 0.07
Direct/Indirect consumer 524 0.88 839 1.23 602 1.01 917 1.35
Other consumer 303 2.83 303 2.83 344 3.21 344 3.21
Total consumer $4,236 1.01% $7,607 1.45% $4,507 1.07% $7,878 1.50%
(1) Excluding the impact of SOP 03-3 is a non-GAAP financial measure. Net charge-offs and managed net losses exclude the impact of SOP 03-3 which decreased net charge-offs and managed net losses on credit card – domestic
$99 million, credit card – foreign $53 million, direct/indirect consumer $78 million, and other consumer $41 million for 2006. The impact of SOP 03-3 on average outstanding held and managed consumer loans and leases
for 2006 was not material.
Bank of America 2006
65