Bank of America 2006 Annual Report Download - page 66
Download and view the complete annual report
Please find page 66 of the 2006 Bank of America annual report below. You can navigate through the pages in the report by either clicking on the pages listed below, or by using the keyword search tool below to find specific information within the annual report.-
 1
1 -
2
-
3
-
4
-
5
-
6
-
7
-
8
-
9
-
10
-
11
-
12
-
13
-
14
-
15
-
16
-
17
-
18
-
19
-
20
-
21
-
22
-
23
-
24
-
25
-
26
-
27
-
28
-
29
-
30
-
31
-
32
-
33
-
34
-
35
-
36
-
37
-
38
-
39
-
40
-
41
-
42
-
43
-
44
-
45
-
46
-
47
-
48
-
49
-
50
-
51
-
52
-
53
-
54
-
55
-
 56
56 -
 57
57 -
 58
58 -
 59
59 -
 60
60 -
 61
61 -
 62
62 -
 63
63 -
 64
64 -
 65
65 -
 66
66 -
 67
67 -
 68
68 -
 69
69 -
 70
70 -
 71
71 -
 72
72 -
 73
73 -
 74
74 -
 75
75 -
 76
76 -
77
-
78
-
79
-
80
-
81
-
82
-
83
-
84
-
85
-
86
-
87
-
88
-
89
-
90
-
91
-
92
-
93
-
94
-
95
-
96
-
97
-
98
-
99
-
100
-
101
-
102
-
103
-
104
-
105
-
106
-
107
-
108
-
109
-
110
-
111
-
112
-
113
-
114
-
115
-
116
-
117
-
118
-
119
-
120
-
121
-
122
-
123
-
124
-
125
-
126
-
127
-
128
-
129
-
130
-
131
-
132
-
133
-
134
-
135
-
136
-
137
-
138
-
139
-
140
-
141
-
142
-
143
-
144
-
145
-
146
-
147
-
148
-
149
-
150
-
151
-
152
-
153
-
154
-
155
 |
 |

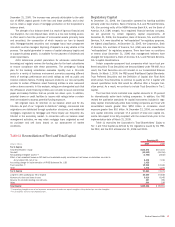
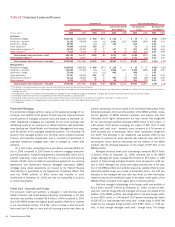
Table 12 Consumer Loans and Leases
December 31 Year Ended December 31
Outstandings Nonperforming
(1)
Accruing Past Due 90
Days or More
(2)
Net Charge-offs /
Losses
Net Charge-off /
Loss Ratios
(3)
(Dollars in millions) 2006 2005 2006 2005 2006 2005 2006 2005 2006 2005
Held basis
Residential mortgage
$241,181
$182,596
$ 660
$570
$ 118
$–
$39
$27
0.02%
0.02%
Credit card – domestic
61,195
58,548
n/a
n/a
1,991
1,197
3,094
3,652
4.85
6.76
Credit card – foreign
10,999
–
n/a
n/a
184
–
225
–
2.46
–
Home equity lines
74,888
62,098
249
117
–
–
51
31
0.07
0.05
Direct/Indirect consumer
(4)
68,224
45,490
44
37
347
75
524
248
0.88
0.55
Other consumer
(5)
9,218
6,725
77
61
38
15
303
275
2.83
3.99
Total consumer loans and leases – held
465,705
355,457
1,030
785
2,678
1,287
4,236
4,233
1.01
1.26
Securitizations impact (6)
110,151
12,523
2
–
2,407
23
3,371
434
3.22
3.34
Total consumer loans and leases – managed
$575,856
$367,980
$1,032
$785
$5,085
$1,310
$7,607
$4,667
1.45%
1.34%
Managed basis
Residential mortgage
$245,840
$188,380
$ 660
$570
$ 118
$–
$39
$27
0.02%
0.02%
Credit card – domestic
142,599
60,785
n/a
n/a
3,828
1,217
5,395
4,086
3.89
6.92
Credit card – foreign
27,890
–
n/a
n/a
608
–
980
–
3.95
–
Home equity lines
75,197
62,546
251
117
–
3
51
31
0.07
0.05
Direct/Indirect consumer
75,112
49,544
44
37
493
75
839
248
1.23
0.53
Other consumer
9,218
6,725
77
61
38
15
303
275
2.83
3.99
Total consumer loans and leases – managed
$575,856
$367,980
$1,032
$785
$5,085
$1,310
$7,607
$4,667
1.45%
1.34%
(1) The definition of nonperforming does not include consumer credit card and consumer non-real estate loans and leases.
(2) Accruing past due 90 days or more as a percentage of outstanding held and managed consumer loans and leases was 0.58 percent and 0.88 percent at December 31, 2006 and 0.36 percent and 0.36 percent at
December 31, 2005.
(3) Net charge-off/loss ratios are calculated as held net charge-offs or managed net losses divided by average outstanding held or managed loans and leases during the year for each loan and lease category.
(4) Outstandings include home equity loans of $12.8 billion and $8.1 billion at December 31, 2006 and 2005.
(5) Outstandings include foreign consumer loans of $6.2 billion and $3.8 billion and consumer finance loans of $2.8 billion and $2.8 billion at December 31, 2006 and 2005.
(6) For additional information on our managed portfolio and securitizations, refer to Note 9 of the Consolidated Financial Statements.
n/a = not applicable
Residential Mortgage
The residential mortgage portfolio makes up the largest percentage of our
consumer loan portfolio at 52 percent of held consumer loans and leases
and 43 percent of managed consumer loans and leases at December 31,
2006. Residential mortgages are originated for the home purchase and
refinancing needs of our customers in Global Consumer and Small Busi-
ness Banking and Global Wealth and Investment Management and repre-
sent 22 percent of the managed residential portfolio. The remaining 78
percent of the managed portfolio is in All Other, which includes Corporate
Treasury and Corporate Investments, and is comprised of purchased or
originated residential mortgage loans used to manage our overall ALM
activities.
On a held basis, outstanding loans and leases increased $58.6 bil-
lion in 2006 compared to 2005 driven by retained mortgage production
and bulk purchases. Nonperforming balances increased $90 million due to
portfolio seasoning. Loans past due 90 days or more and still accruing
interest of $118 million is related to repurchases pursuant to our servicing
agreements with Government National Mortgage Association (GNMA)
mortgage pools whose repayments are insured by the Federal Housing
Administration or guaranteed by the Department of Veterans Affairs. This
past due GNMA portfolio of $161 million was included in loans
held-for-sale at December 31, 2005 and was not reclassified to conform
to current presentation.
Credit Card – Domestic and Foreign
The consumer credit card portfolio is managed in Card Services within
Global Consumer and Small Business Banking. Outstandings in the held
domestic loan portfolio increased $2.6 billion in 2006 compared to 2005
due to the MBNA merger and organic growth partially offset by an increase
in net securitization activity. The $794 million increase in held domestic
loans past due 90 days or more and still accruing interest was driven by
portfolio seasoning, the trend toward more normalized delinquency levels
following bankruptcy reform and the addition of the MBNA portfolio, includ-
ing the adoption of MBNA collection practices and policies that have
historically led to higher delinquencies but lower losses. Net charge-offs
for the held domestic portfolio decreased $558 million to $3.1 billion, or
4.85 percent (5.00 percent excluding the impact of SOP 03-3) of total
average held credit card – domestic loans compared to 6.76 percent in
2005 primarily due to bankruptcy reform which accelerated charge-offs
into 2005. This decrease in net charge-offs was partially offset by new
advances on accounts for which previous loan balances were sold to the
securitization trusts, portfolio seasoning and the addition of the MBNA
portfolio. See the following discussion of the impact of SOP 03-3 on the
MBNA portfolio.
Managed domestic credit card outstandings increased $81.8 billion
to $142.6 billion at December 31, 2006, primarily due to the MBNA
merger. Managed net losses increased $1.3 billion to $5.4 billion, or 3.89
percent of total average managed domestic loans compared to 6.92 per-
cent in 2005. Managed net losses were higher primarily due to the addi-
tion of the MBNA portfolio and portfolio seasoning, partially offset by lower
bankruptcy-related losses as a result of bankruptcy reform. The 303 bps
decrease in the managed net loss ratio was driven by lower bankruptcy-
related losses and the beneficial impact of the higher credit quality of the
MBNA portfolio compared to the legacy Bank of America portfolio.
Held and managed outstandings in the foreign credit card portfolio of
$11.0 billion and $27.9 billion at December 31, 2006, as well as delin-
quencies, held net charge-offs and managed net losses, are related to the
addition of the MBNA portfolio. Net charge-offs for the held foreign portfo-
lio were $225 million, or 2.46 percent (3.05 percent excluding the impact
of SOP 03-3) of total average held credit card – foreign loans in 2006. Net
losses for the managed foreign portfolio were $980 million, or 3.95 per-
cent, of total average managed credit card – foreign loans. The foreign
64
Bank of America 2006