Philips 2011 Annual Report Download - page 101
Download and view the complete annual report
Please find page 101 of the 2011 Philips annual report below. You can navigate through the pages in the report by either clicking on the pages listed below, or by using the keyword search tool below to find specific information within the annual report.-
 1
1 -
2
-
3
-
4
-
5
-
6
-
7
-
8
-
9
-
10
-
11
-
12
-
13
-
14
-
15
-
16
-
17
-
18
-
19
-
20
-
21
-
22
-
23
-
24
-
25
-
26
-
27
-
28
-
29
-
30
-
31
-
32
-
33
-
34
-
35
-
36
-
37
-
38
-
39
-
40
-
41
-
42
-
43
-
44
-
45
-
46
-
47
-
48
-
49
-
50
-
51
-
52
-
53
-
54
-
55
-
56
-
57
-
58
-
59
-
60
-
61
-
62
-
63
-
64
-
65
-
66
-
67
-
68
-
69
-
70
-
71
-
72
-
73
-
74
-
75
-
76
-
77
-
78
-
79
-
80
-
81
-
82
-
83
-
84
-
85
-
86
-
87
-
88
-
89
-
90
-
 91
91 -
 92
92 -
 93
93 -
 94
94 -
 95
95 -
 96
96 -
 97
97 -
 98
98 -
 99
99 -
 100
100 -
 101
101 -
 102
102 -
 103
103 -
 104
104 -
 105
105 -
 106
106 -
 107
107 -
 108
108 -
 109
109 -
 110
110 -
 111
111 -
112
-
113
-
114
-
115
-
116
-
117
-
118
-
119
-
120
-
121
-
122
-
123
-
124
-
125
-
126
-
127
-
128
-
129
-
130
-
131
-
132
-
133
-
134
-
135
-
136
-
137
-
138
-
139
-
140
-
141
-
142
-
143
-
144
-
145
-
146
-
147
-
148
-
149
-
150
-
151
-
152
-
153
-
154
-
155
-
156
-
157
-
158
-
159
-
160
-
161
-
162
-
163
-
164
-
165
-
166
-
167
-
168
-
169
-
170
-
171
-
172
-
173
-
174
-
175
-
176
-
177
-
178
-
179
-
180
-
181
-
182
-
183
-
184
-
185
-
186
-
187
-
188
-
189
-
190
-
191
-
192
-
193
-
194
-
195
-
196
-
197
-
198
-
199
-
200
-
201
-
202
-
203
-
204
-
205
-
206
-
207
-
208
-
209
-
210
-
211
-
212
-
213
-
214
-
215
-
216
-
217
-
218
-
219
-
220
-
221
-
222
-
223
-
224
-
225
-
226
-
227
-
228
 |
 |

10 Supervisory Board report 10.2.2 - 10.2.5
Annual Report 2011 101
Share ownership
To further align the interests of the members of the Board
of Management and shareholders, restricted share rights
granted to members of the Board of Management shall be
retained for a period of at least five years or until at least
the end of their employment, if this period is shorter.
Scenario analysis
The Remuneration Committee annually conducts
scenario analysis. This includes the calculation of
remuneration under different scenarios, whereby
different Philips performance assumptions and corporate
actions are looked at. The Supervisory Board concluded
that the current policy has and continues to prove to
function well in terms of the relationship between the
strategic objectives and the chosen performance criteria.
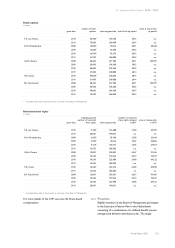
10.2.3 Remuneration costs
The table below gives an overview of the costs incurred
by the Company in the financial year in relation to the
remuneration of the Board of Management. Costs related
to stock option and restricted share right grants are taken
by the Company over a number of years. As a
consequence, the costs mentioned below in the columns
stock options and restricted share rights are the
accounting cost of multi-year grants given to members of
the Board of Management during their board
membership.
Information on the individual remuneration of the
(former) members of the Board of Management is shown
in the tables below as well as in the table in note 32,
Information on remuneration.
The previously granted stock options and restricted share
rights to Messrs. P-J. Sivignon and R.S. Provoost continue
to vest in accordance with the terms and conditions of
the Long-Term Incentive Plan.
Remuneration Board of Management 20111)
in euros
Costs in the year
annual
base salary base salary
realized
annual incentive
stock
options
restricted
share rights
pension
costs
other
compensation
F.A. van Houten2) 1,100,000 825,000 363,000 125,957 253,926 297,179 39,709
R.H. Wirahadiraksa2) 600,000 450,000 148,500 105,477 180,686 170,299 72,125
G.H.A. Dutiné 650,000 650,000 214,500 462,263 334,186 245,018 143,774
P.A.J. Nota2) 600,000 450,000 148,500 131,159 255,159 168,532 67,067
S.H. Rusckowski 700,000 687,500 231,000 211,915 341,856 254,975 336,773
1) Reference date for board membership is December 31, 2011
2) Costs mentinoned relate to the period of board membership. Messrs Van Houten, Wirahadiraksa and Nota have been appointed per March 31, 2011, therefore the amounts
are related to the period April - December 2011.
This table ‘Remuneration Board of Management 2011’
forms an integral part of the Group financial statements,
please refer to note 32, Information on remuneration.
10.2.4 Base salary
The salaries of the members of the Board of Management
have been increased in line with the policy for other
employees on the yearly review date in April 2011.
10.2.5 Annual Incentive
Each year, a variable cash incentive (Annual Incentive) can
be earned, based on the achievement of specific and
challenging targets. The Annual Incentive criteria are for
80% the financial indicators of the Company (net income,
comparable sales growth and free cash flow). In 2011 the
highest weighting was for comparable sales growth. The
comparable sales growth calculation focuses on organic
growth of the businesses and excludes currency
translation effects and impact of acquisitions/
divestments. The 20% team targets comprise the major
elements of the management agenda, including
sustainability elements such as Employee Engagement
Score and Green Product sales.
The on-target Annual Incentive percentage is set at 60%
of the base salary for members of the Board of
Management and 80% of the base salary for the President/
CEO, and the maximum Annual Incentive achievable is
120% of the annual base salary for members of the Board
of Management and for the President/CEO it is 160% of
the annual base salary.