Philips 2011 Annual Report Download - page 161
Download and view the complete annual report
Please find page 161 of the 2011 Philips annual report below. You can navigate through the pages in the report by either clicking on the pages listed below, or by using the keyword search tool below to find specific information within the annual report.-
 1
1 -
2
-
3
-
4
-
5
-
6
-
7
-
8
-
9
-
10
-
11
-
12
-
13
-
14
-
15
-
16
-
17
-
18
-
19
-
20
-
21
-
22
-
23
-
24
-
25
-
26
-
27
-
28
-
29
-
30
-
31
-
32
-
33
-
34
-
35
-
36
-
37
-
38
-
39
-
40
-
41
-
42
-
43
-
44
-
45
-
46
-
47
-
48
-
49
-
50
-
51
-
52
-
53
-
54
-
55
-
56
-
57
-
58
-
59
-
60
-
61
-
62
-
63
-
64
-
65
-
66
-
67
-
68
-
69
-
70
-
71
-
72
-
73
-
74
-
75
-
76
-
77
-
78
-
79
-
80
-
81
-
82
-
83
-
84
-
85
-
86
-
87
-
88
-
89
-
90
-
91
-
92
-
93
-
94
-
95
-
96
-
97
-
98
-
99
-
100
-
101
-
102
-
103
-
104
-
105
-
106
-
107
-
108
-
109
-
110
-
111
-
112
-
113
-
114
-
115
-
116
-
117
-
118
-
119
-
120
-
121
-
122
-
123
-
124
-
125
-
126
-
127
-
128
-
129
-
130
-
131
-
132
-
133
-
134
-
135
-
136
-
137
-
138
-
139
-
140
-
141
-
142
-
143
-
144
-
145
-
146
-
147
-
148
-
149
-
150
-
 151
151 -
 152
152 -
 153
153 -
 154
154 -
 155
155 -
 156
156 -
 157
157 -
 158
158 -
 159
159 -
 160
160 -
 161
161 -
 162
162 -
 163
163 -
 164
164 -
 165
165 -
 166
166 -
 167
167 -
 168
168 -
 169
169 -
 170
170 -
 171
171 -
172
-
173
-
174
-
175
-
176
-
177
-
178
-
179
-
180
-
181
-
182
-
183
-
184
-
185
-
186
-
187
-
188
-
189
-
190
-
191
-
192
-
193
-
194
-
195
-
196
-
197
-
198
-
199
-
200
-
201
-
202
-
203
-
204
-
205
-
206
-
207
-
208
-
209
-
210
-
211
-
212
-
213
-
214
-
215
-
216
-
217
-
218
-
219
-
220
-
221
-
222
-
223
-
224
-
225
-
226
-
227
-
228
 |
 |

12 Group financial statements 12.11 - 12.11
Annual Report 2011 161
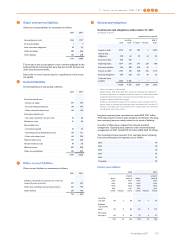
Amounts recognized in the Consolidated statements of comprehensive
income:
2009 2010 2011
Actuarial losses 678 1,535 1,517
Change in the effect of the cap on prepaids 369 427 (869)
Total recognized in Consolidated
statements of comprehensive income 1,047 1,962 648
Total recognized in net periodic pension
cost and Consolidated statements of
comprehensive income 1,050 1,859 668
Actual return on plan assets 1,218 1,807 1,740
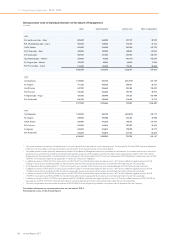
The pension expense of defined-benefit plans is recognized in the
following line items in the Consolidated statements of income:
2009 2010 2011
Cost of sales 6 6 8
Selling expenses 12 12 7
General and administrative expenses (14) (120) 3
Research and development expenses (4) (3) −
− (105) 18
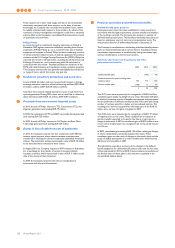
The Company also sponsors defined-contribution and similar types of
plans for a significant number of salaried employees. The total cost of
these plans amounted to EUR 120 million (2010: EUR 114 million, 2009:
EUR 103 million). In 2011, the defined-contribution cost includes
contributions to multi-employer plans of EUR 8 million (2010: EUR 6
million; 2009: EUR 5 million).
Cash flows and costs in 2012
Philips expects considerable cash outflows in relation to employee
benefits which are estimated to amount to EUR 633 million in 2012,
consisting of EUR 420 million employer contributions to defined-
benefit pension plans, EUR 135 million employer contributions to
defined-contribution pension plans, EUR 54 million expected cash
outflows in relation to unfunded pension plans and EUR 24 million in
relation to unfunded retiree medical plans. The employer contributions
to defined-benefit pension plans are expected to amount to EUR 203
million for the Netherlands and EUR 217 million for other countries.
The Company plans to fund part of the existing deficit in the US pension
plan in 2012, which amount is included in the amounts aforementioned.
The cost for 2012 is expected to amount to EUR 134 million, consisting
of EUR (12) million for defined-benefit pension plans, EUR 135 million
for defined-contribution pension plans and EUR 11 million for defined-
benefit retiree medical plans.
Assumptions
A significant demographic assumption used in the actuarial valuations
is the mortality table.
The mortality tables used for the Company’s major schemes are:
Netherlands: Prognosis table 2010-2060 including experience rating
TW2010
United Kingdom retirees: SAPS 2002- short cohort 2009 - medium
cohort 1% floor
United States: RP2000 CH Fully Generational
Germany: Richttafeln 2005 G.K. Heubeck
Longevity is one of the risks of postemployment benefits. The table
below illustrates the impact on the 2011 defined-benefit obligation and
expense of a 10% decrease in the assumed rates of mortality for the
Company’s major schemes. A 10% decrease in assumed mortality rates
equals improvement of life expectancy by 0.5 - 1 year.
Increase of current year:
DBO expense
581 27
The Expected Return on Assets for any funded plan equals the average
of the expected returns per asset class weighted by their portfolio
weights in accordance with the fund’s strategic asset allocation. Where
liability-driven investment (LDI) strategies apply, the weights are in
accordance with the actual matching part and the strategic asset
allocation of the return portfolio.
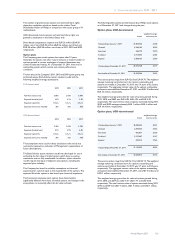
The weighted averages of the assumptions used to calculate the
defined-benefit obligations as of December 31 were as follows:
2010 2011
Netherlands other Netherlands other
Discount rate 4.7% 5.3% 3.9% 4.4%
Rate of
compensation
increase * 4.0% * 2.9%
The weighted averages of the assumptions used to calculate the net
periodic pension cost for years ended December 31:
2010 2011
Netherlands other Netherlands other
Discount rate 5.0% 5.7% 4.7% 5.3%
Expected returns on
plan assets 5.7% 6.5% 5.3% 6.2%
Rate of
compensation
increase * 4.1% * 4.0%
* The rate of compensation increase for the Netherlands consists of a general
compensation increase and an individual salary increase based on merit, seniority
and promotion. The average individual salary increase for all active participants
for the remaining working lifetime is 0.75% annually. The assumed rate of general
compensation increase for the Netherlands for calculating the projected benefit
obligations amounts to 2.0% (2010: 2.0%). The indexation assumption used to
calculate the projected benefit obligations for the Netherlands is 1.0% (2010: 1.0%).
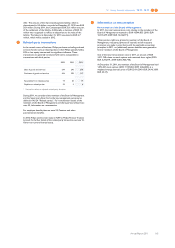
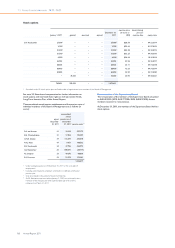
Historical data
2007 2008 2009 2010 2011
Present value of defined-
benefit obligations 18,679 16,846 17,720 20,166 22,413
Fair value of plan assets 20,200 17,899 18,470 20,080 21,249
Surplus 1,521 1,053 750 (86) (1,164)
Experience adjustments in
% on:
- defined-benefit
obligations (gain) loss (0.8%) 1.2% (0.9%) 0.8% (0.6%)
- fair value of plan assets
(gain) loss 2.8% 10.9% (0.6%) (3.6%) (3.0%)
Defined-benefit plans: other postretirement benefits
In addition to providing pension benefits, the Company provides other
postretirement benefits, primarily retiree medical benefits, in certain
countries. The Company funds those other postretirement benefit
plans as claims are incurred.