Philips 2011 Annual Report Download - page 190
Download and view the complete annual report
Please find page 190 of the 2011 Philips annual report below. You can navigate through the pages in the report by either clicking on the pages listed below, or by using the keyword search tool below to find specific information within the annual report.-
 1
1 -
2
-
3
-
4
-
5
-
6
-
7
-
8
-
9
-
10
-
11
-
12
-
13
-
14
-
15
-
16
-
17
-
18
-
19
-
20
-
21
-
22
-
23
-
24
-
25
-
26
-
27
-
28
-
29
-
30
-
31
-
32
-
33
-
34
-
35
-
36
-
37
-
38
-
39
-
40
-
41
-
42
-
43
-
44
-
45
-
46
-
47
-
48
-
49
-
50
-
51
-
52
-
53
-
54
-
55
-
56
-
57
-
58
-
59
-
60
-
61
-
62
-
63
-
64
-
65
-
66
-
67
-
68
-
69
-
70
-
71
-
72
-
73
-
74
-
75
-
76
-
77
-
78
-
79
-
80
-
81
-
82
-
83
-
84
-
85
-
86
-
87
-
88
-
89
-
90
-
91
-
92
-
93
-
94
-
95
-
96
-
97
-
98
-
99
-
100
-
101
-
102
-
103
-
104
-
105
-
106
-
107
-
108
-
109
-
110
-
111
-
112
-
113
-
114
-
115
-
116
-
117
-
118
-
119
-
120
-
121
-
122
-
123
-
124
-
125
-
126
-
127
-
128
-
129
-
130
-
131
-
132
-
133
-
134
-
135
-
136
-
137
-
138
-
139
-
140
-
141
-
142
-
143
-
144
-
145
-
146
-
147
-
148
-
149
-
150
-
151
-
152
-
153
-
154
-
155
-
156
-
157
-
158
-
159
-
160
-
161
-
162
-
163
-
164
-
165
-
166
-
167
-
168
-
169
-
170
-
171
-
172
-
173
-
174
-
175
-
176
-
177
-
178
-
179
-
 180
180 -
 181
181 -
 182
182 -
 183
183 -
 184
184 -
 185
185 -
 186
186 -
 187
187 -
 188
188 -
 189
189 -
 190
190 -
 191
191 -
 192
192 -
 193
193 -
 194
194 -
 195
195 -
 196
196 -
 197
197 -
 198
198 -
 199
199 -
 200
200 -
201
-
202
-
203
-
204
-
205
-
206
-
207
-
208
-
209
-
210
-
211
-
212
-
213
-
214
-
215
-
216
-
217
-
218
-
219
-
220
-
221
-
222
-
223
-
224
-
225
-
226
-
227
-
228
 |
 |

14 Sustainability statements 14.3 - 14.4
190 Annual Report 2011
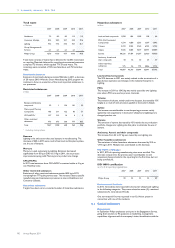
Total waste
in kilotons
2007 2008 2009 2010 2011
Healthcare 7.9 8.2 8.2 11.2 9.3
Consumer Lifestyle 40.4 28.0 20.1 23.2 19.6
Lighting 79.2 77.3 69.3 70.1 65.1
Group Management &
Services 0.1 0.1 0.1 0.1 −
Philips Group 127.6 113.6 97.7 104.6 94.0
Total waste consists of waste that is delivered for landfill, incineration
or recycling. Materials delivered for recycling via an external contractor
comprised 72 kilotons, which equaled 77% of total waste. The
remaining waste consisted of 16% non-hazardous and 7% hazardous
waste.
Restricted substances
Emissions of restricted substances totaled 946 kilos in 2011, a decrease
of 2% versus 2010. With the Green Manufacturing 2015 program we
continue to focus on a selection of the most important substances in
our processes.
Restricted substances
in kilos
2007 2008 2009 2010 2011
Benzene and Benzene
compounds 52 1 136 101 55
Mercury and Mercury
Compounds 185 211 122 83 51
CFCs/HCFCs1) 157 213 14 4 5
Other restricted
substances 973 673 366 777 835
Total 1,367 1,098 638 965 946
1) Excluding cooling systems
Benzene
Lighting is the only sector that uses benzene in manufacturing. The
decrease of 46% in 2011 was a result of less load, and the plan to phase-
out the use of benzene.
Mercury
Mercury is used exclusively by Lighting. Emissions decreased
significantly from 83 kg in 2010 to 51 kg in 2011, due to process
improvements (using solid Mercury) and a product mix change.
CFCs/HCFCs
In 2011 total emissions from CFCs/HCFCs remained stable at 5 kg at
one Healthcare site.
Other restricted substances
Emissions of other restricted substances totaled 835 kg in 2011,
increasing from 777 kg the previous year. This increase is due to specific
manufacturing and maintenance processes at sites in Healthcare and
Consumer Lifestyle.
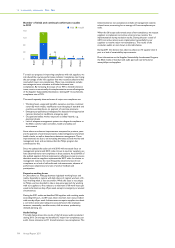
Hazardous substances
Targets have been set on a selected number of hazardous substances.
Hazardous substances
in kilos
2007 2008 2009 2010 2011
Lead and lead compounds 1,838 684 1,958 108 44
PFCs (Per Fluorinated
Compounds) 1,534 1,858 2,535 1,507 1,842
Toluene 2,210 2,524 2,160 6,745 5,745
Xylene 4,506 3,684 4,619 30,491 37,889
Styrene 80,526 37,454 21,567 22,920 19,920
Antimony, Arsenic and
their compounds 18 16 30 24 37
Other hazardous
substances 175 96 775 3,846 1,715
Total 90,807 46,316 33,644 65,641 67,192
Lead and lead compounds
The 59% decrease in 2011 was mainly related to the termination of a
glass furnace operation and changes in the industrial footprint in
Lighting.
PFCs
The increase in 2011 to 1,842 kg was mainly caused by two Lighting
sites where PFCs are used as process chemicals.
Toluene
The emission of toluene, mainly used in wet lacquers, decreased by 15%
largely as a result of new processes applied at Consumer Lifestyle.
Xylene
The increase was attributable to wet lacquering processes mainly
applied by new acquisitions in Consumer Lifestyle and Lighting and a
changed product mix.
Styrene
The emission of styrene decreased by 13% mainly due to production
portfolio changes at a Lighting site that plans to eliminate the use of
styrene.
Antimony, Arsenic and their compounds
The increase from 24 to 37 kg was caused by one Lighting site.
Other hazardous substances
The emissions of other hazardous substances decreased by 55% to
1,715 kg in 2011. Multiple sites contributed to this decrease.
ISO 14001 certification
In 2011, 89% of reporting manufacturing sites were certified. This
decrease compared to the previous year is attributable to new
acquisitions being included in the reporting for the first time, but not
being certified yet.
ISO 14001 certification
as a % of all reporting organizations
2007 2008 2009 2010 2011
Philips Group 90 95 92 95 89
Environmental Incidents
In 2011, 12 incidents were reported by Consumer Lifestyle and Lighting
in the following categories. They were related to water (3), restricted
substances (1), noise (2) and fire (6).
One non-material fine was reported in our EcoVision system in
connection with one of the incidents.
14.4 Social indicators
Engagement
In September Philips employees took part in the Engagement Survey,
giving their answers to 40 questions on leadership, management
capabilities, alignment with the company’s vision, identification with the