Philips 2011 Annual Report Download - page 170
Download and view the complete annual report
Please find page 170 of the 2011 Philips annual report below. You can navigate through the pages in the report by either clicking on the pages listed below, or by using the keyword search tool below to find specific information within the annual report.-
 1
1 -
2
-
3
-
4
-
5
-
6
-
7
-
8
-
9
-
10
-
11
-
12
-
13
-
14
-
15
-
16
-
17
-
18
-
19
-
20
-
21
-
22
-
23
-
24
-
25
-
26
-
27
-
28
-
29
-
30
-
31
-
32
-
33
-
34
-
35
-
36
-
37
-
38
-
39
-
40
-
41
-
42
-
43
-
44
-
45
-
46
-
47
-
48
-
49
-
50
-
51
-
52
-
53
-
54
-
55
-
56
-
57
-
58
-
59
-
60
-
61
-
62
-
63
-
64
-
65
-
66
-
67
-
68
-
69
-
70
-
71
-
72
-
73
-
74
-
75
-
76
-
77
-
78
-
79
-
80
-
81
-
82
-
83
-
84
-
85
-
86
-
87
-
88
-
89
-
90
-
91
-
92
-
93
-
94
-
95
-
96
-
97
-
98
-
99
-
100
-
101
-
102
-
103
-
104
-
105
-
106
-
107
-
108
-
109
-
110
-
111
-
112
-
113
-
114
-
115
-
116
-
117
-
118
-
119
-
120
-
121
-
122
-
123
-
124
-
125
-
126
-
127
-
128
-
129
-
130
-
131
-
132
-
133
-
134
-
135
-
136
-
137
-
138
-
139
-
140
-
141
-
142
-
143
-
144
-
145
-
146
-
147
-
148
-
149
-
150
-
151
-
152
-
153
-
154
-
155
-
156
-
157
-
158
-
159
-
 160
160 -
 161
161 -
 162
162 -
 163
163 -
 164
164 -
 165
165 -
 166
166 -
 167
167 -
 168
168 -
 169
169 -
 170
170 -
 171
171 -
 172
172 -
 173
173 -
 174
174 -
 175
175 -
 176
176 -
 177
177 -
 178
178 -
 179
179 -
 180
180 -
181
-
182
-
183
-
184
-
185
-
186
-
187
-
188
-
189
-
190
-
191
-
192
-
193
-
194
-
195
-
196
-
197
-
198
-
199
-
200
-
201
-
202
-
203
-
204
-
205
-
206
-
207
-
208
-
209
-
210
-
211
-
212
-
213
-
214
-
215
-
216
-
217
-
218
-
219
-
220
-
221
-
222
-
223
-
224
-
225
-
226
-
227
-
228
 |
 |

33 12 Group financial statements 12.11 - 12.11
170 Annual Report 2011
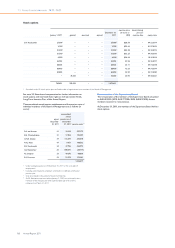
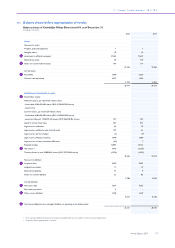
33 Fair value of financial assets and liabilities
The estimated fair value of financial instruments has been determined
by the Company using available market information and appropriate
valuation methods. The estimates presented are not necessarily
indicative of the amounts that will ultimately be realized by the
Company upon maturity or disposal. The use of different market
assumptions and/or estimation methods may have a material effect on
the estimated fair value amounts.
For cash and cash equivalents, current receivables, current payables,
interest accrual and short-term debts, the carrying amounts
approximate fair value, because of the short maturity of these
instruments.
The fair value of Philips’ debt is estimated on the basis of the quoted
market prices for certain issues, or on the basis of discounted cash flow
analysis based upon market rates plus Philips’ spread for the particular
tenors of the borrowing arrangement. Accrued interest is not within
the carrying amount or estimated fair value of debt.
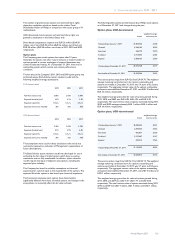
December 31, 2010 December 31, 2011
carrying
amount
estimated
fair value
carrying
amount
estimated
fair value
Financial assets
Carried at fair value:
Available-for-sale financial
assets - non-current 298 298 139 139
Available-for-sale financial
assets - current − − − −
Fair value through profit and
loss - non-current 62 62 67 67
Fair value through profit and
loss - current − − − −
Derivative financial
instruments 112 112 229 229
472 472 435 435
Carried at (amortized) cost:
Cash and cash equivalents 5,833 5,833 3,147 3,147
Other current financial assets 5 5 − −
Loans and receivables:
Other non-current loans
and receivables including
guarantee deposits 53 53 72 72
Loans to investments in
associates 3 3 2 2
Receivables - current 4,3551) 4,3551) 4,415 4,415
Receivables - non-current 88 88 127 127
Held-to-maturity
investments 2 2 3 3
Available-for-sale financial
assets 64 64 65 65
10,403 10,403 7,831 7,831
Financial liabilities
Carried at fair value:
Derivative financial
instruments (564) (564) (744) (744)
Carried at (amortized) cost:
Accounts payable (3,691) (3,691) (3,346) (3,346)
Interest accrual (87) (87) (65) (65)
Debt (4,658) (5,156) (3,860) (4,489)
(8,436) (8,934) (7,271) (7,900)
1) Adjusted for income tax receivable as income tax receivable does not qualify
as a financial asset