Philips 2011 Annual Report Download - page 42
Download and view the complete annual report
Please find page 42 of the 2011 Philips annual report below. You can navigate through the pages in the report by either clicking on the pages listed below, or by using the keyword search tool below to find specific information within the annual report.-
 1
1 -
2
-
3
-
4
-
5
-
6
-
7
-
8
-
9
-
10
-
11
-
12
-
13
-
14
-
15
-
16
-
17
-
18
-
19
-
20
-
21
-
22
-
23
-
24
-
25
-
26
-
27
-
28
-
29
-
30
-
31
-
 32
32 -
 33
33 -
 34
34 -
 35
35 -
 36
36 -
 37
37 -
 38
38 -
 39
39 -
 40
40 -
 41
41 -
 42
42 -
 43
43 -
 44
44 -
 45
45 -
 46
46 -
 47
47 -
 48
48 -
 49
49 -
 50
50 -
 51
51 -
 52
52 -
53
-
54
-
55
-
56
-
57
-
58
-
59
-
60
-
61
-
62
-
63
-
64
-
65
-
66
-
67
-
68
-
69
-
70
-
71
-
72
-
73
-
74
-
75
-
76
-
77
-
78
-
79
-
80
-
81
-
82
-
83
-
84
-
85
-
86
-
87
-
88
-
89
-
90
-
91
-
92
-
93
-
94
-
95
-
96
-
97
-
98
-
99
-
100
-
101
-
102
-
103
-
104
-
105
-
106
-
107
-
108
-
109
-
110
-
111
-
112
-
113
-
114
-
115
-
116
-
117
-
118
-
119
-
120
-
121
-
122
-
123
-
124
-
125
-
126
-
127
-
128
-
129
-
130
-
131
-
132
-
133
-
134
-
135
-
136
-
137
-
138
-
139
-
140
-
141
-
142
-
143
-
144
-
145
-
146
-
147
-
148
-
149
-
150
-
151
-
152
-
153
-
154
-
155
-
156
-
157
-
158
-
159
-
160
-
161
-
162
-
163
-
164
-
165
-
166
-
167
-
168
-
169
-
170
-
171
-
172
-
173
-
174
-
175
-
176
-
177
-
178
-
179
-
180
-
181
-
182
-
183
-
184
-
185
-
186
-
187
-
188
-
189
-
190
-
191
-
192
-
193
-
194
-
195
-
196
-
197
-
198
-
199
-
200
-
201
-
202
-
203
-
204
-
205
-
206
-
207
-
208
-
209
-
210
-
211
-
212
-
213
-
214
-
215
-
216
-
217
-
218
-
219
-
220
-
221
-
222
-
223
-
224
-
225
-
226
-
227
-
228
 |
 |

5 Group performance 5.1.13 - 5.1.13
42 Annual Report 2011
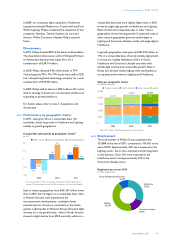
Compared to 2010, the number of employees increased
by 5,723. This figure included 4,759 additional employees
from acquisitions and reduction of 479 employees via
divestments. The remaining increase centered primarily
on Healthcare, mainly in North America.
Approximately 53% of the Philips workforce is located in
mature geographies, and about 47% in growth
geographies. In 2011, the number of employees in mature
geographies increased slightly as headcount reduction
from organizational restructuring was more than offset by
additional headcount from growing businesses within
Healthcare. Growth geographies headcount increased by
5,208, mainly as a result of acquisitions in Consumer
Lifestyle.
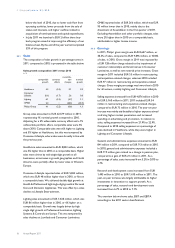
Employees per sector
in FTEs at year-end
2009 2010 2011
Healthcare1) 34,525 36,253 37,955
Consumer Lifestyle 13,625 14,095 18,291
Lighting 51,653 53,888 53,168
Group Management & Services 11,586 11,929 12,474
111,389 116,165 121,888
Discontinued operations 4,764 3,610 3,353
116,153 119,775 125,241
1) Adjusted to reflect a change of employees reported for the past periods
Employees per geographic cluster
in FTEs at year-end
20091) 20101) 2011
Western Europe 34,174 33,557 33,515
North America 27,055 27,881 28,249
Other mature geographies 3,094 3,045 3,234
Total mature geographies 64,323 64,483 64,998
Growth geographies 47,066 51,682 56,890
111,389 116,165 121,888
Discontinued operations 4,764 3,610 3,353
116,153 119,775 125,241
1) Adjusted to reflect a change of employees reported in the Healthcare sector
Employment
in FTEs
20091) 20101) 2011
Position at beginning of year 121,654 116,153 119,775
Consolidation changes:
acquisitions 2,432 1,457 4,759
divestments (276) (307) (479)
Comparable change (7,657) 2,472 1,186
Position at year-end 116,153 119,775 125,241
of which:
continued operations 111,389 116,165 121,888
discontinued operations 4,764 3,610 3,353
1) Adjusted to reflect a change of employees reported in the Healthcare sector