Philips 2011 Annual Report Download - page 46
Download and view the complete annual report
Please find page 46 of the 2011 Philips annual report below. You can navigate through the pages in the report by either clicking on the pages listed below, or by using the keyword search tool below to find specific information within the annual report.-
 1
1 -
2
-
3
-
4
-
5
-
6
-
7
-
8
-
9
-
10
-
11
-
12
-
13
-
14
-
15
-
16
-
17
-
18
-
19
-
20
-
21
-
22
-
23
-
24
-
25
-
26
-
27
-
28
-
29
-
30
-
31
-
32
-
33
-
34
-
35
-
 36
36 -
 37
37 -
 38
38 -
 39
39 -
 40
40 -
 41
41 -
 42
42 -
 43
43 -
 44
44 -
 45
45 -
 46
46 -
 47
47 -
 48
48 -
 49
49 -
 50
50 -
 51
51 -
 52
52 -
 53
53 -
 54
54 -
 55
55 -
 56
56 -
57
-
58
-
59
-
60
-
61
-
62
-
63
-
64
-
65
-
66
-
67
-
68
-
69
-
70
-
71
-
72
-
73
-
74
-
75
-
76
-
77
-
78
-
79
-
80
-
81
-
82
-
83
-
84
-
85
-
86
-
87
-
88
-
89
-
90
-
91
-
92
-
93
-
94
-
95
-
96
-
97
-
98
-
99
-
100
-
101
-
102
-
103
-
104
-
105
-
106
-
107
-
108
-
109
-
110
-
111
-
112
-
113
-
114
-
115
-
116
-
117
-
118
-
119
-
120
-
121
-
122
-
123
-
124
-
125
-
126
-
127
-
128
-
129
-
130
-
131
-
132
-
133
-
134
-
135
-
136
-
137
-
138
-
139
-
140
-
141
-
142
-
143
-
144
-
145
-
146
-
147
-
148
-
149
-
150
-
151
-
152
-
153
-
154
-
155
-
156
-
157
-
158
-
159
-
160
-
161
-
162
-
163
-
164
-
165
-
166
-
167
-
168
-
169
-
170
-
171
-
172
-
173
-
174
-
175
-
176
-
177
-
178
-
179
-
180
-
181
-
182
-
183
-
184
-
185
-
186
-
187
-
188
-
189
-
190
-
191
-
192
-
193
-
194
-
195
-
196
-
197
-
198
-
199
-
200
-
201
-
202
-
203
-
204
-
205
-
206
-
207
-
208
-
209
-
210
-
211
-
212
-
213
-
214
-
215
-
216
-
217
-
218
-
219
-
220
-
221
-
222
-
223
-
224
-
225
-
226
-
227
-
228
 |
 |

5 Group performance 5.2.7 - 5.2.8
46 Annual Report 2011
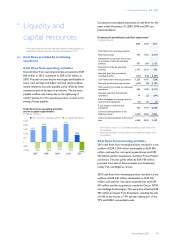
Net debt (cash) to group equity1)
in billions of euros ■-net debt (cash)--■-group equity2)
25
20
15
10
5
0
(5)
(10)
(5.2)
21.9
-31 : 131
2007
0.6
15.6
4 : 96
2008
(0.1)
14.6
-1 : 101
2009
(1.2)
15.1
-8 : 108
2010
0.7
12.4
5 : 95
2011
ratio:
1) For a reconciliation to the most directly comparable GAAP measures, see
chapter 15, Reconciliation of non-GAAP information, of this Annual Report
2) Shareholders’ equity and non-controlling interests
5.2.7 Shareholders’ equity
Shareholders’ equity decreased by EUR 2,691 million in
2011 to EUR 12,355 million at December 31, 2011. The
decrease was mainly as a result of a EUR 1,291 million
lower net income and EUR 447 million actuarial losses
related to pension plans, as well as EUR 751 million
related to the purchase of treasury shares. The dividend
payment to shareholders in 2011 reduced equity by EUR
263 million. The decrease was partially offset by a EUR 86
million increase related to delivery of treasury shares and
net share-based compensation plans.
Shareholders’ equity increased by EUR 451 million in 2010
to EUR 15,046 million at December 31, 2010. The
increase was mainly as a result of a EUR 630 million
improvement within total comprehensive income. The
dividend payment to shareholders in 2010 reduced equity
by EUR 304 million. The decrease was partially offset by
a EUR 111 million increase related to delivery of treasury
shares and net share-based compensation plans.
The number of outstanding common shares of Royal
Philips Electronics at December 31, 2011 was 926 million
(2010: 947 million).
At the end of 2011, the Company held 33.6 million shares
in treasury to cover the future delivery of shares (2010:
37.7 million shares). This was in connection with the 47.1
million rights outstanding at the end of 2011 (2010: 54.9
million rights) under the Company’s long-term incentive
plan and convertible personnel debentures. At the end of
2011, the Company held 49.3 million shares for
cancellation (2010: 1.9 million shares).
5.2.8 Liquidity position
Including the Company’s net debt (cash) position (cash
and cash equivalents, net of debt), listed available-for-
sale financial assets, as well as its EUR 1.8 billion revolving
credit facility, a EUR 900 million bilateral credit facility and
a EUR 500 million bilateral credit facility, the Company
had access to net available liquid resources of EUR 2,597
million as of December 31, 2011, compared to EUR 3,445
million one year earlier.
Liquidity position
in millions of euros
2009 2010 2011
Cash and cash equivalents 4,386 5,833 3,147
Committed revolving credit facility/
CP program/Bilateral loan 1,936 2,000 3,200
Liquidity 6,322 7,833 6,347
Available-for-sale financial assets at
market value 244 270 110
Main listed investments in associates
at market value 113 − −
Short-term debt (627) (1,840) (582)
Long-term debt (3,640) (2,818) (3,278)
Net available liquidity resources 2,412 3,445 2,597
The fair value of the Company’s available-for-sale financial
assets, based on quoted market prices at December 31,
2011, amounted to EUR 110 million. Philips disposed of
its remaining shareholdings in TCL and Digimarc in 2011.
Philips has a EUR 1.8 billion committed revolving credit
facility due in 2015 that can be used for general corporate
purposes. In addition, Philips also has a EUR 900 million
committed bilateral credit facility in place that can be
drawn before July 2013. Furthermore Philips has a USD
2.5 billion commercial paper program, under which it can
issue commercial paper up to 364 days in tenor, both in
the US and in Europe, in any major freely convertible
currency. There is a panel of banks, in Europe and in the
US, which service the program. The interest is at market
rates prevailing at the time of issuance of the commercial
paper. There is no collateral requirement in the
commercial paper program. Also, there are no limitations
on Philips’ use of the program. As at December 31, 2011,
Philips did not have any loans outstanding under these
facilities.
Philips’ existing long-term debt is rated A3 (with negative
outlook as of February 8, 2012) by Moody’s and A- (with
negative outlook as of February 3, 2012) by Standard &
Poor’s. It is Philips’ objective to manage our financial ratios
to be in line with an A rating. There is no assurance that
we will be able to achieve this goal. Ratings are subject to
change at any time. Outstanding long-term bonds and
credit facilities do not have a material adverse change
clause, financial covenants or credit-rating-related
acceleration possibilities.