Philips 2011 Annual Report Download - page 123
Download and view the complete annual report
Please find page 123 of the 2011 Philips annual report below. You can navigate through the pages in the report by either clicking on the pages listed below, or by using the keyword search tool below to find specific information within the annual report.-
 1
1 -
2
-
3
-
4
-
5
-
6
-
7
-
8
-
9
-
10
-
11
-
12
-
13
-
14
-
15
-
16
-
17
-
18
-
19
-
20
-
21
-
22
-
23
-
24
-
25
-
26
-
27
-
28
-
29
-
30
-
31
-
32
-
33
-
34
-
35
-
36
-
37
-
38
-
39
-
40
-
41
-
42
-
43
-
44
-
45
-
46
-
47
-
48
-
49
-
50
-
51
-
52
-
53
-
54
-
55
-
56
-
57
-
58
-
59
-
60
-
61
-
62
-
63
-
64
-
65
-
66
-
67
-
68
-
69
-
70
-
71
-
72
-
73
-
74
-
75
-
76
-
77
-
78
-
79
-
80
-
81
-
82
-
83
-
84
-
85
-
86
-
87
-
88
-
89
-
90
-
91
-
92
-
93
-
94
-
95
-
96
-
97
-
98
-
99
-
100
-
101
-
102
-
103
-
104
-
105
-
106
-
107
-
108
-
109
-
110
-
111
-
112
-
 113
113 -
 114
114 -
 115
115 -
 116
116 -
 117
117 -
 118
118 -
 119
119 -
 120
120 -
 121
121 -
 122
122 -
 123
123 -
 124
124 -
 125
125 -
 126
126 -
 127
127 -
 128
128 -
 129
129 -
 130
130 -
 131
131 -
 132
132 -
 133
133 -
134
-
135
-
136
-
137
-
138
-
139
-
140
-
141
-
142
-
143
-
144
-
145
-
146
-
147
-
148
-
149
-
150
-
151
-
152
-
153
-
154
-
155
-
156
-
157
-
158
-
159
-
160
-
161
-
162
-
163
-
164
-
165
-
166
-
167
-
168
-
169
-
170
-
171
-
172
-
173
-
174
-
175
-
176
-
177
-
178
-
179
-
180
-
181
-
182
-
183
-
184
-
185
-
186
-
187
-
188
-
189
-
190
-
191
-
192
-
193
-
194
-
195
-
196
-
197
-
198
-
199
-
200
-
201
-
202
-
203
-
204
-
205
-
206
-
207
-
208
-
209
-
210
-
211
-
212
-
213
-
214
-
215
-
216
-
217
-
218
-
219
-
220
-
221
-
222
-
223
-
224
-
225
-
226
-
227
-
228
 |
 |

12 Group financial statements 12.7 - 12.7
Annual Report 2011 123
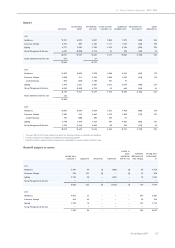
12.7 Consolidated statements of cash flows
in millions of euros
Consolidated statements of cash flows of the Philips Group for the years ended December 31
2009 2010 2011
Cash flows from operating activities
Net (loss) income 424 1,452 (1,291)
Loss from discontinued operations 52 26 515
Adjustments to reconcile net income (loss) to net cash provided by operating activities:
Depreciation and amortization 1,395 1,356 1,456
Impairment of goodwill, other non-current financial assets and investments in associates 2 5 1,387
Net gain on sale of assets (139) (204) (88)
Income from investments in associates (23) (18) (14)
Dividends received from investments in associates 35 19 44
Dividends paid to non-controlling interests (4) (4) (4)
Decrease (increase) in receivables and other current assets 337 (241) (339)
(Increase) decrease in inventories 516 (498) (81)
(Decrease) increase in accounts payable and accrued and other current liabilities (203) 755 (259)
Increase in non-current receivables, other assets and other liabilities (365) (297) (596)
Decrease (increase) in provisions (667) (211) 6
Other items 31 (19) 100
Net cash provided by operating activities 1,391 2,121 836
Cash flows from investing activities
Purchase of intangible assets (96) (80) (116)
Expenditures on development assets (162) (193) (231)
Capital expenditures on property, plant and equipment (495) (621) (725)
Proceeds from disposals of property, plant and equipment 125 129 128
Cash from (used for) derivatives and securities
26 (38) (25) 26
Purchase of other non-current financial assets (6) (16) (43)
Proceeds from other non-current financial assets
27 718 268 87
Purchase of businesses, net of cash acquired (295) (225) (509)
Proceeds from sale of interests in businesses, net of cash disposed of 84 117 19
Net cash used for investing activities (165) (646) (1,364)
Cash flows from financing activities
Proceeds from (payments on) issuance of short-term debt (201) 143 (217)
Principal payments on short-term portion of long-term debt (50) (78) (1,097)
Proceeds from issuance of long-term debt 312 71 457
Treasury shares transaction 29 65 (671)
Dividends paid (634) (296) (259)
Net cash used for financing activities (544) (95) (1,787)
Net cash (used for) provided by continuing operations 682 1,380 (2,315)