Philips 2011 Annual Report Download - page 171
Download and view the complete annual report
Please find page 171 of the 2011 Philips annual report below. You can navigate through the pages in the report by either clicking on the pages listed below, or by using the keyword search tool below to find specific information within the annual report.-
 1
1 -
2
-
3
-
4
-
5
-
6
-
7
-
8
-
9
-
10
-
11
-
12
-
13
-
14
-
15
-
16
-
17
-
18
-
19
-
20
-
21
-
22
-
23
-
24
-
25
-
26
-
27
-
28
-
29
-
30
-
31
-
32
-
33
-
34
-
35
-
36
-
37
-
38
-
39
-
40
-
41
-
42
-
43
-
44
-
45
-
46
-
47
-
48
-
49
-
50
-
51
-
52
-
53
-
54
-
55
-
56
-
57
-
58
-
59
-
60
-
61
-
62
-
63
-
64
-
65
-
66
-
67
-
68
-
69
-
70
-
71
-
72
-
73
-
74
-
75
-
76
-
77
-
78
-
79
-
80
-
81
-
82
-
83
-
84
-
85
-
86
-
87
-
88
-
89
-
90
-
91
-
92
-
93
-
94
-
95
-
96
-
97
-
98
-
99
-
100
-
101
-
102
-
103
-
104
-
105
-
106
-
107
-
108
-
109
-
110
-
111
-
112
-
113
-
114
-
115
-
116
-
117
-
118
-
119
-
120
-
121
-
122
-
123
-
124
-
125
-
126
-
127
-
128
-
129
-
130
-
131
-
132
-
133
-
134
-
135
-
136
-
137
-
138
-
139
-
140
-
141
-
142
-
143
-
144
-
145
-
146
-
147
-
148
-
149
-
150
-
151
-
152
-
153
-
154
-
155
-
156
-
157
-
158
-
159
-
160
-
 161
161 -
 162
162 -
 163
163 -
 164
164 -
 165
165 -
 166
166 -
 167
167 -
 168
168 -
 169
169 -
 170
170 -
 171
171 -
 172
172 -
 173
173 -
 174
174 -
 175
175 -
 176
176 -
 177
177 -
 178
178 -
 179
179 -
 180
180 -
 181
181 -
182
-
183
-
184
-
185
-
186
-
187
-
188
-
189
-
190
-
191
-
192
-
193
-
194
-
195
-
196
-
197
-
198
-
199
-
200
-
201
-
202
-
203
-
204
-
205
-
206
-
207
-
208
-
209
-
210
-
211
-
212
-
213
-
214
-
215
-
216
-
217
-
218
-
219
-
220
-
221
-
222
-
223
-
224
-
225
-
226
-
227
-
228
 |
 |

12 Group financial statements 12.11 - 12.11 34
Annual Report 2011 171
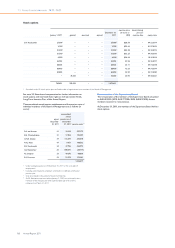
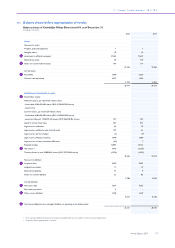
The table below analyses financial instruments carried at fair value, by
different hierarchy levels:
Fair value hierarchy
level 1 level 2 level 3 total
December 31, 2011
Available-for-sale financial
assets - non-current 139 139
Available-for-sale financial
assets - current − −
Financial assets designated at
fair value through profit and
loss - non-current 59 8 67
Financial asses designated at
fair value through profit and
loss - current − −
Derivative financial
instruments - assets 229 229
Total financial assets carried
at fair value 198 229 8 435
Derivative financial
instruments - liabilities (744) − (744)
December 31, 2010
Available-for-sale financial
assets - non-current 298 298
Available-for-sale financial
assets - current − −
Financial assets designated at
fair value through profit and
loss - non-current 62 62
Financial assets designated at
fair value through profit and
loss - current − −
Derivative financial
instruments - assets 112 112
Total financial assets carried
at fair value 360 112 − 472
Derivative financial
instruments - liabilities (564) (564)
Specific valuation techniques used to value financial instruments include:
Level 1
Instruments included in level 1 are comprised primarily of listed equity
investments classified as available-for-sale financial assets, investees and
financial assets designated at fair value through profit and loss.
The fair value of financial instruments traded in active markets is based
on quoted market prices at the balance sheet date. A market is regarded
as active if quoted prices are readily and regularly available from an
exchange, dealer, broker, industry group, pricing service, or regulatory
agency, and those prices represent actual and regularly occurring
market transactions on an arm’s length basis.
Level 2
The fair value of financial instruments that are not traded in an active
market (for example, over-the-counter derivatives or convertible bond
instruments) are determined by using valuation techniques. These
valuation techniques maximize the use of observable market data
where it is available and rely as little as possible on entity-specific
estimates. If all significant inputs required to fair value an instrument
are based on observable market data, the instrument is included in level
2.
The fair value of derivatives is calculated as the present value of the
estimated future cash flows based on observable interest yield curves
and foreign exchange rates.
The valuation of convertible bond instruments uses observable market
quoted data for the options and present value calculations using
observable yield curves for the fair value of the bonds.
Level 3
If one or more of the significant inputs are not based on observable
market data, the instrument is included in level 3. The arrangement with
the UK Pension Fund in conjunction with the sale of NXP is a financial
instrument carried at fair value classified as level 3. At the end of 2011,
the fair value of this instrument is estimated to be EUR 8 million with
the changes of fair value recorded to financial income and expense.
Please refer to note 12, Other non-current financial assets for more
details.
The table below shows the reconciliation from the beginning balance
to the end balance for fair value measured in Level 3 of the fair value
hierarchy.
in thousands of euro
equity securities
Balance at January 1, 2011 −
Total gains and losses recognised in:
- profit or loss 8
- other comprehensive income −
Balance at December 31, 2011 8
34 Details of treasury risks
Philips is exposed to several types of financial risk. This note further
analyzes financial risks. Philips does not purchase or hold derivative
financial instruments for speculative purposes. Information regarding
financial instruments is included in note 33, Fair value of financial assets
and liabilities.
Liquidity risk
Liquidity risk is the risk that an entity will encounter difficulty in meeting
obligations associated with financial liabilities.
Liquidity risk for the group is monitored through the Treasury liquidity
committee which tracks the development of the actual cash flow
position for the group and uses input from a number of sources in order
to forecast the overall liquidity position both on a short and long-
term basis. Corporate Treasury invests surplus cash in money market
deposits with appropriate maturities to ensure sufficient liquidity is
available to meet liabilities when due.
The rating of the Company’s debt by major rating services may improve
or deteriorate. As a result, Philips’ future borrowing capacity may be
influenced and its financing costs may fluctuate. Philips has various
sources to mitigate the liquidity risk for the group. At the reporting
date, Philips had EUR 3,147 million in cash and cash equivalents (2010:
EUR 5,833 million), within which short-term deposits of EUR 2,422
million (2010: EUR 5,229 million) and other liquid assets of EUR 119
million (2010: EUR 101 million). Philips pools cash from subsidiaries to
the extent legally and economically feasible; cash not pooled remains
available for local operational or investment needs.
Furthermore, Philips has a USD 2.5 billion Commercial Paper Program,
a EUR 1.8 billion revolving credit facility that can be used for general
corporate purpose, a bilateral credit facility of EUR 900 million, and a
EUR 500 million bilateral credit facility. As of December 31, 2011,
Philips did not have any loans outstanding under any of these facilities.
Additionally Philips also held EUR 110 million of equity investments in
available-for-sale financial assets (fair value at December 31, 2011).
Currency risk
Currency risk is the risk that the fair value or future cash flows of a
financial instrument will fluctuate because of changes in foreign
exchange rates. Currency fluctuations may impact Philips’ financial
results. Philips is exposed to currency risk in the following areas: