Philips 2011 Annual Report Download - page 188
Download and view the complete annual report
Please find page 188 of the 2011 Philips annual report below. You can navigate through the pages in the report by either clicking on the pages listed below, or by using the keyword search tool below to find specific information within the annual report.-
 1
1 -
2
-
3
-
4
-
5
-
6
-
7
-
8
-
9
-
10
-
11
-
12
-
13
-
14
-
15
-
16
-
17
-
18
-
19
-
20
-
21
-
22
-
23
-
24
-
25
-
26
-
27
-
28
-
29
-
30
-
31
-
32
-
33
-
34
-
35
-
36
-
37
-
38
-
39
-
40
-
41
-
42
-
43
-
44
-
45
-
46
-
47
-
48
-
49
-
50
-
51
-
52
-
53
-
54
-
55
-
56
-
57
-
58
-
59
-
60
-
61
-
62
-
63
-
64
-
65
-
66
-
67
-
68
-
69
-
70
-
71
-
72
-
73
-
74
-
75
-
76
-
77
-
78
-
79
-
80
-
81
-
82
-
83
-
84
-
85
-
86
-
87
-
88
-
89
-
90
-
91
-
92
-
93
-
94
-
95
-
96
-
97
-
98
-
99
-
100
-
101
-
102
-
103
-
104
-
105
-
106
-
107
-
108
-
109
-
110
-
111
-
112
-
113
-
114
-
115
-
116
-
117
-
118
-
119
-
120
-
121
-
122
-
123
-
124
-
125
-
126
-
127
-
128
-
129
-
130
-
131
-
132
-
133
-
134
-
135
-
136
-
137
-
138
-
139
-
140
-
141
-
142
-
143
-
144
-
145
-
146
-
147
-
148
-
149
-
150
-
151
-
152
-
153
-
154
-
155
-
156
-
157
-
158
-
159
-
160
-
161
-
162
-
163
-
164
-
165
-
166
-
167
-
168
-
169
-
170
-
171
-
172
-
173
-
174
-
175
-
176
-
177
-
 178
178 -
 179
179 -
 180
180 -
 181
181 -
 182
182 -
 183
183 -
 184
184 -
 185
185 -
 186
186 -
 187
187 -
 188
188 -
 189
189 -
 190
190 -
 191
191 -
 192
192 -
 193
193 -
 194
194 -
 195
195 -
 196
196 -
 197
197 -
 198
198 -
199
-
200
-
201
-
202
-
203
-
204
-
205
-
206
-
207
-
208
-
209
-
210
-
211
-
212
-
213
-
214
-
215
-
216
-
217
-
218
-
219
-
220
-
221
-
222
-
223
-
224
-
225
-
226
-
227
-
228
 |
 |

14 Sustainability statements 14.2 - 14.3
188 Annual Report 2011
Consumer Lifestyle
In 2011, the Consumer Lifestyle sector invested about EUR 67 million in
Green Innovation. The sector is dedicated to developing new Green
Products with a focus on further enhancing energy efficiency and closing
material loops, for example by using recycled materials or offering
better recyclability.
Lighting
In 2011, Lighting invested a record EUR 291 million in Green Innovation
compared to EUR 230 million in 2010. The focus continues to be on
developing new energy-efficient lighting solutions, further enhancing
current Green Products and realizing technological breakthroughs in
the area of solid-state lighting.
Corporate Technologies
Corporate Technologies invested about EUR 36 million, spread over
Green Innovation projects focused on global challenges related to
water, air, waste and energy. One example of a Philips Research project
is related to LED-based treatments. Many diseases, e.g. in dermatology
or pain, are currently treated with drugs like steroids, cortisone and
opiates. Unfortunately, these often cause negative side effects. Philips
Lighting’s Light & Health Venture, in close collaboration with Philips
Research are developing innovative LED-based solutions. By
understanding how blue light affects many human biological and
physiological processes, and applying our expertise in LED and textile
technology, Philips created the BlueTouch Pain Relief Patch – answering
the needs of millions of back pain sufferers around the world. Another
application is the Bilirubin Blanket that treats neonatal jaundice, a
condition affecting many newborns and premature babies.
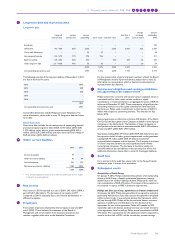
Operational carbon footprint and energy efficiency
In the course of 2011 we implemented a new IT solution for our carbon
footprint reporting, thereby further improving the data quality and the
accuracy of the reporting process. To maintain comparability, we
recalculated the carbon footprint for all previous years in this new IT
solution, resulting in slightly different figures for those years (mostly for
non-industrial operations).
Our operational carbon footprint decreased 4% in 2011.
Operational carbon footprint
in kilotons CO2-equivalent
2007 2008 2009 2010 2011
Manufacturing 947 959 909 767 703
Non-industrial operations 211 181 174 159 155
Business travel 276 265 220 247 256
Logistics 714 706 627 672 657
Philips Group 2,148 2,111 1,930 1,845 1,771
Our total operational carbon footprint can also be expressed according
to the three scopes of the Greenhouse Gas Protocol.
Operational carbon footprint by Greenhouse Gas
Protocol scopes
in kilotons CO2-equivalent
2007 2008 2009 2010 2011
Scope 1 442 467 447 441 431
Scope 2 716 673 636 485 427
Scope 3 990 971 847 919 913
Philips Group 2,148 2,111 1,930 1,845 1,771
Operational energy efficiency and carbon footprint: 2011
details
The 2011 results can be attributed to several factors:
• Accounting for 40% of the total footprint, total CO2 emissions from
manufacturing decreased 8% due to continued energy efficiency
improvement programs, our changing industrial footprint and the
further increase of the share of purchased electricity from renewable
sources to 44% of total purchased electricity.
• CO2 emissions from non-industrial operations (offices, warehouses,
etc.) represent 9% of the total. Our acquisitions resulted in a slight
overall increase in floor space. However, CO2 emissions decreased
2% as we continued to centralize and re-allocate existing facilities,
focusing on the most efficient use of facility space and increasing the
share of purchased electricity from renewable sources.
• The total CO2 emissions related to business travel, accounting for
14% of our carbon footprint, increased 4%. CO2 emissions from air
travel increased slightly as the number of travel movements
increased. However, due to our green lease car policy, our lease cars
continued to become more CO2 efficient, thereby further reducing
the average CO2 emissions per kilometer by 8% compared to 2010.
We will continue to promote videoconferencing as an alternative to
travel as well.
• Overall CO2 emissions from logistics, representing approximately
one third of the total, decreased 2%. This decrease is a result of our
continued focus on optimizing container utilization and opting for
the cleanest and most cost effective mode of transport, in which we
continue to shift from air to sea freight where possible.
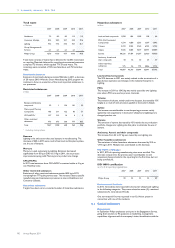
Operational carbon footprint for logistics
in kilotons CO2-equivalent
2007 2008 2009 2010 2011
Air transport 338 305 308 345 328
Road transport 205 211 174 160 176
Sea transport 171 190 145 167 153
Philips Group 714 706 627 672 657
For comparison purposes, the most relevant ratios for CO2 emissions
and energy efficiency are provided below. We reduced CO2 emissions
by 4%. Our energy efficiency – expressed in terajoules per million EUR
sales – improved 4% as well, because of our continued focus on
operational excellence and efficiency improvements.
Ratios relating to carbon emissions and energy use
2007 2008 2009 2010 2011
Operational CO2 emissions in
kilotons CO2-equivalent 2,148 2,111 1,930 1,845 1,771
Operational CO2 efficiency in
tons CO2-equivalent per million
euro sales 80 80 83 73 70
Operational energy use in
terajoules 34,450 33,831 31,145 32,766 31,402
Operational energy efficiency in
terajoules per million euro sales 1.29 1.28 1.34 1.29 1.24
Carbon emissions in our Supply Chain
In 2011, we engaged with the Carbon Disclosure Project and Trucost,
an environmental data and insight company specializing in supply chain
CO2 reporting, to quantify the carbon emissions in our supply chain.
The emissions were estimated at approximately 5.6 million tons, which
is almost 6 times our scope 1 and 2 emissions. The study also unveiled
the “hotspots” in our supply chain, which allows us to focus our energy
efficiency improvement and carbon reduction activities with our
suppliers.
14.3 Green Manufacturing 2015
In 2010, we decided to group all activities related to improving the
environmental performance of our manufacturing facilities (including
chemicals management) under the Green Manufacturing 2015 program.
The program focuses on most contributors to climate change, but also
addresses water, recycling of waste and chemical substances.