Philips 2011 Annual Report Download - page 41
Download and view the complete annual report
Please find page 41 of the 2011 Philips annual report below. You can navigate through the pages in the report by either clicking on the pages listed below, or by using the keyword search tool below to find specific information within the annual report.-
 1
1 -
2
-
3
-
4
-
5
-
6
-
7
-
8
-
9
-
10
-
11
-
12
-
13
-
14
-
15
-
16
-
17
-
18
-
19
-
20
-
21
-
22
-
23
-
24
-
25
-
26
-
27
-
28
-
29
-
30
-
 31
31 -
 32
32 -
 33
33 -
 34
34 -
 35
35 -
 36
36 -
 37
37 -
 38
38 -
 39
39 -
 40
40 -
 41
41 -
 42
42 -
 43
43 -
 44
44 -
 45
45 -
 46
46 -
 47
47 -
 48
48 -
 49
49 -
 50
50 -
 51
51 -
52
-
53
-
54
-
55
-
56
-
57
-
58
-
59
-
60
-
61
-
62
-
63
-
64
-
65
-
66
-
67
-
68
-
69
-
70
-
71
-
72
-
73
-
74
-
75
-
76
-
77
-
78
-
79
-
80
-
81
-
82
-
83
-
84
-
85
-
86
-
87
-
88
-
89
-
90
-
91
-
92
-
93
-
94
-
95
-
96
-
97
-
98
-
99
-
100
-
101
-
102
-
103
-
104
-
105
-
106
-
107
-
108
-
109
-
110
-
111
-
112
-
113
-
114
-
115
-
116
-
117
-
118
-
119
-
120
-
121
-
122
-
123
-
124
-
125
-
126
-
127
-
128
-
129
-
130
-
131
-
132
-
133
-
134
-
135
-
136
-
137
-
138
-
139
-
140
-
141
-
142
-
143
-
144
-
145
-
146
-
147
-
148
-
149
-
150
-
151
-
152
-
153
-
154
-
155
-
156
-
157
-
158
-
159
-
160
-
161
-
162
-
163
-
164
-
165
-
166
-
167
-
168
-
169
-
170
-
171
-
172
-
173
-
174
-
175
-
176
-
177
-
178
-
179
-
180
-
181
-
182
-
183
-
184
-
185
-
186
-
187
-
188
-
189
-
190
-
191
-
192
-
193
-
194
-
195
-
196
-
197
-
198
-
199
-
200
-
201
-
202
-
203
-
204
-
205
-
206
-
207
-
208
-
209
-
210
-
211
-
212
-
213
-
214
-
215
-
216
-
217
-
218
-
219
-
220
-
221
-
222
-
223
-
224
-
225
-
226
-
227
-
228
 |
 |

5 Group performance 5.1.11 - 5.1.13
Annual Report 2011 41
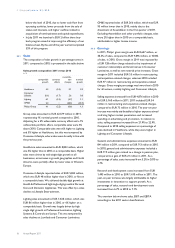
In 2009, we completed eight acquisitions. Healthcare
acquisitions included Meditronics, Traxtal and InnerCool.
Within Lighting, Philips completed the acquisition of four
companies: Dynalite, Teletrol Systems, Ilti Luce and
Selecon. Within Consumer Lifestyle, Philips acquired
Saeco.
Divestments
In 2011, Philips divested 80% of the shares in Assembléon.
The Assembléon shares were sold to H2 Equity Partners,
an Amsterdam-based private equity firm, for a
consideration of EUR 14 million.
In 2010, Philips divested 9.4% of the shares in TPV
Technology Ltd (TPV). The TPV shares were sold to CEIC
Ltd, a Hong Kong-based technology company, for a cash
consideration of EUR 98 million.
In 2009, Philips sold its shares in FIMI to Barco NV, in line
with its strategy to divest non-core activities and focus on
expanding its growth platforms.
For details, please refer to note 7, Acquisitions and
divestments.
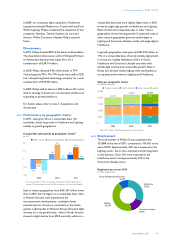
5.1.12 Performance by geographic cluster
In 2011, sales grew 4% on a comparable basis (1%
nominally), driven by growth in Healthcare and Lighting,
notably in growth geographies.
Comparable sales growth by geographic cluster1)
as a %
■-Philips Group--■-growth geographies--■-mature geographies
15
7.5
0
(7.5)
(15)
(9.2)
(4.4)
(11.0)
2009
4.8
13.6
1.2
2010
4.1
11.1
1.0
2011
1) For a reconciliation to the most directly comparable GAAP measures, see
chapter 15, Reconciliation of non-GAAP information, of this Annual Report
Sales in mature geographies were EUR 247 million lower
than in 2010, but 1% higher on a comparable basis. Sales
in Western Europe were impacted by the
macroeconomic developments, resulting in lower
nominal sales for all sectors, particularly in the fourth
quarter. Lighting sales in Western Europe showed a slight
increase on a comparable basis. Sales in North America
showed a slight decline from 2010 nominally, while on a
comparable basis they were slightly higher than in 2010,
driven by single-digit growth at Healthcare and Lighting.
Both nominal and comparable sales in other mature
geographies showed strong growth. Comparable sales in
other mature geographies grew by double-digits at
Lighting and Consumer Lifestyle, and by mid single-digit at
Healthcare.
In growth geographies, sales grew by EUR 539 million, or
11% on a comparable basis, driven by double-digit growth
in all sectors, notably Healthcare (15%). In China,
Healthcare and Consumer Lifestyle recorded solid
double-digit nominal and comparable growth. Sales in
Russia also showed double-digit growth, attributable to
strong sales performance at Lighting and Healthcare.
Sales per geographic cluster
in millions of euros
■-Western Europe_■-North America_■-other mature_■-growth
25,000
20,000
15,000
10,000
5,000
0
2009
6,605
6,602
1,242
5,643
20,092
20101)
6,630
7,086
1,618
6,953
22,287
2011
6,368
6,978
1,741
7,492
22,579
1) Revised to reflect an adjusted geographic cluster allocation
5.1.13 Employment
The total number of Philips Group employees was
121,888 at the end of 2011, compared to 116,165 at the
end of 2010. Approximately 44% were employed in the
Lighting sector, due to the continued vertical integration
in this business. Some 31% were employed in the
Healthcare sector and approximately 15% in the
Consumer Lifestyle sector.
Employees per sector 2011
in FTEs at year-end
Healthcare
37,955
Consumer Lifestyle
18,291
Lighting
53,168
Group Management & Services
12,474