Philips 2011 Annual Report Download - page 191
Download and view the complete annual report
Please find page 191 of the 2011 Philips annual report below. You can navigate through the pages in the report by either clicking on the pages listed below, or by using the keyword search tool below to find specific information within the annual report.-
 1
1 -
2
-
3
-
4
-
5
-
6
-
7
-
8
-
9
-
10
-
11
-
12
-
13
-
14
-
15
-
16
-
17
-
18
-
19
-
20
-
21
-
22
-
23
-
24
-
25
-
26
-
27
-
28
-
29
-
30
-
31
-
32
-
33
-
34
-
35
-
36
-
37
-
38
-
39
-
40
-
41
-
42
-
43
-
44
-
45
-
46
-
47
-
48
-
49
-
50
-
51
-
52
-
53
-
54
-
55
-
56
-
57
-
58
-
59
-
60
-
61
-
62
-
63
-
64
-
65
-
66
-
67
-
68
-
69
-
70
-
71
-
72
-
73
-
74
-
75
-
76
-
77
-
78
-
79
-
80
-
81
-
82
-
83
-
84
-
85
-
86
-
87
-
88
-
89
-
90
-
91
-
92
-
93
-
94
-
95
-
96
-
97
-
98
-
99
-
100
-
101
-
102
-
103
-
104
-
105
-
106
-
107
-
108
-
109
-
110
-
111
-
112
-
113
-
114
-
115
-
116
-
117
-
118
-
119
-
120
-
121
-
122
-
123
-
124
-
125
-
126
-
127
-
128
-
129
-
130
-
131
-
132
-
133
-
134
-
135
-
136
-
137
-
138
-
139
-
140
-
141
-
142
-
143
-
144
-
145
-
146
-
147
-
148
-
149
-
150
-
151
-
152
-
153
-
154
-
155
-
156
-
157
-
158
-
159
-
160
-
161
-
162
-
163
-
164
-
165
-
166
-
167
-
168
-
169
-
170
-
171
-
172
-
173
-
174
-
175
-
176
-
177
-
178
-
179
-
180
-
 181
181 -
 182
182 -
 183
183 -
 184
184 -
 185
185 -
 186
186 -
 187
187 -
 188
188 -
 189
189 -
 190
190 -
 191
191 -
 192
192 -
 193
193 -
 194
194 -
 195
195 -
 196
196 -
 197
197 -
 198
198 -
 199
199 -
 200
200 -
 201
201 -
202
-
203
-
204
-
205
-
206
-
207
-
208
-
209
-
210
-
211
-
212
-
213
-
214
-
215
-
216
-
217
-
218
-
219
-
220
-
221
-
222
-
223
-
224
-
225
-
226
-
227
-
228
 |
 |

14 Sustainability statements 14.4 - 14.4
Annual Report 2011 191
brand, communication, reward and recognition, diversity and inclusion
and sustainability. The participation rate was 87%, a slight increase
compared to 2010.
Engagement Index
The Employee Engagement Index (EEI) is the single measure of the
overall level of employee engagement at Philips. It is a combination of
perceptions and attitudes related to employee satisfaction,
commitment and advocacy.
Employee Engagement Index
2007 2008 2009 2010 2011
% favorable 67 72 71 77 76
% neutral 20 16 15 12 14
% unfavorable 13 12 14 11 10
The EEI decreased 1 point to 76% in 2011 compared with 2010. The
target for 2012 is to achieve the high-permance norm.
People Leadership Index
We have developed the People Leadership Index (PLI), which focuses
on overall people leadership effectiveness, as managers contribute
significantly to the engagement of their employees. Our PLI – measuring
7 aspects relating to management capabilities – increased by 2% overall,
reaching 78% this year. We believe, these positive results reflect
employees’ confidence in the availability of their leaders and underline
the fact that Philips’ managers are encouraging engagement. It also
shows that our efforts to improve our managers’ leadership skills are
yielding results.
A look at the results
Over the years we have created a solid platform for engagement by
improving our leaders’ people management capabilities. Analyzing a
number of high performing units, we learned that significant
improvements are possible and how this can be achieved. The biggest
advancements in our EEI scores were seen where teams worked on
areas identified last year as needing improvement. Putting the EEI
results into action is therefore very important. Employees were given
the opportunity to participate in “deep dives”, in which they analyzed
their team’s EEI performance and prepared concrete action plans for
improvement.
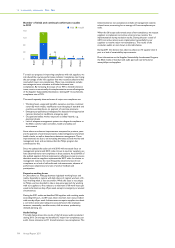
Diversity and inclusion
We continue to focus on increasing the opportunities for women and
other under-represented groups in key positions, and on developing a
diverse talent pipeline, as we know diversity enables us to better serve
our customers. In 2011, Philips employed 36% females, a slight increase
compared to last year.
Workforce diversity
in % ■-Male1)-■-Female1)
100
50
0
57
43
57
43
57
43
Staff
73
27
72
28
72
28
Professionals
84
16
84
16
82
18
Management
90
10
89
11
87
13
Executives
1) Left to right: 2009, 2010 and 2011
as a % of total executives
2007 2008 2009 2010 2011
Female executives 8 10 10 11 13
Executives
In 2011, Philips made progress towards its targets relating to the
diversity of the company’s executive population. The share of female
executives increased to more than 13% compared to 11% in 2010 –
just two percentage points off the 2012 target of 15% female executives.
The share of executives with Brazilian, Russian, Indian and Chinese
nationality increased from 5% to over 8% compared to the 2012 target
of 10% of the total population. Overall, the 567 executives of Philips
represent 31 different nationalities.
Employees per age category
in % ■-Male1)-■-Female1)
60
30
05
8
6
8
6
8
under 25
26
32
27
33
28
33
25-35
31
31
30
30
30
31
35-45
26
21
25
20
24
20
45-55
12
8
12
9
12
8
over 55
1) Left to right: 2009, 2010 and 2011
New hire diversity
in % ■-Male1)-■-Female1)
100
50
0
55
45
58
42
62
38
Staff
67
33
69
31
68
32
Professionals
82
18
78
22
76
24
Management
87
13
75
25
71
29
Executives
1) Left to right: 2009, 2010 and 2011
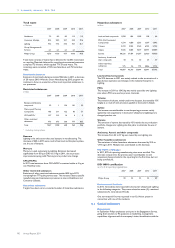
In 2011, the turnover of Philips employees amounted to 11%.
Employee turnover
in %
2011
Female 13
Male 10
Philips Group 11
Developing our people
Employees across the world can access detailed information about our
Global Learning Curricula and register for courses online via our Global
Learning Portal, Learning @ Philips. In 2011 we extended the range of
programs and provided free and unlimited access to our employees. As
a result, we have recorded a significant increase in course participation.