Philips 2011 Annual Report Download - page 139
Download and view the complete annual report
Please find page 139 of the 2011 Philips annual report below. You can navigate through the pages in the report by either clicking on the pages listed below, or by using the keyword search tool below to find specific information within the annual report.-
 1
1 -
2
-
3
-
4
-
5
-
6
-
7
-
8
-
9
-
10
-
11
-
12
-
13
-
14
-
15
-
16
-
17
-
18
-
19
-
20
-
21
-
22
-
23
-
24
-
25
-
26
-
27
-
28
-
29
-
30
-
31
-
32
-
33
-
34
-
35
-
36
-
37
-
38
-
39
-
40
-
41
-
42
-
43
-
44
-
45
-
46
-
47
-
48
-
49
-
50
-
51
-
52
-
53
-
54
-
55
-
56
-
57
-
58
-
59
-
60
-
61
-
62
-
63
-
64
-
65
-
66
-
67
-
68
-
69
-
70
-
71
-
72
-
73
-
74
-
75
-
76
-
77
-
78
-
79
-
80
-
81
-
82
-
83
-
84
-
85
-
86
-
87
-
88
-
89
-
90
-
91
-
92
-
93
-
94
-
95
-
96
-
97
-
98
-
99
-
100
-
101
-
102
-
103
-
104
-
105
-
106
-
107
-
108
-
109
-
110
-
111
-
112
-
113
-
114
-
115
-
116
-
117
-
118
-
119
-
120
-
121
-
122
-
123
-
124
-
125
-
126
-
127
-
128
-
 129
129 -
 130
130 -
 131
131 -
 132
132 -
 133
133 -
 134
134 -
 135
135 -
 136
136 -
 137
137 -
 138
138 -
 139
139 -
 140
140 -
 141
141 -
 142
142 -
 143
143 -
 144
144 -
 145
145 -
 146
146 -
 147
147 -
 148
148 -
 149
149 -
150
-
151
-
152
-
153
-
154
-
155
-
156
-
157
-
158
-
159
-
160
-
161
-
162
-
163
-
164
-
165
-
166
-
167
-
168
-
169
-
170
-
171
-
172
-
173
-
174
-
175
-
176
-
177
-
178
-
179
-
180
-
181
-
182
-
183
-
184
-
185
-
186
-
187
-
188
-
189
-
190
-
191
-
192
-
193
-
194
-
195
-
196
-
197
-
198
-
199
-
200
-
201
-
202
-
203
-
204
-
205
-
206
-
207
-
208
-
209
-
210
-
211
-
212
-
213
-
214
-
215
-
216
-
217
-
218
-
219
-
220
-
221
-
222
-
223
-
224
-
225
-
226
-
227
-
228
 |
 |

12 Group financial statements 12.11 - 12.11 3
Annual Report 2011 139
Display. Total financial expense was EUR 387 million, including
impairment charges amounting to EUR 58 million mainly from
shareholdings in NXP, and EUR 15 million of accretion expenses mainly
associated with discounted asbestos and environmental provisions.
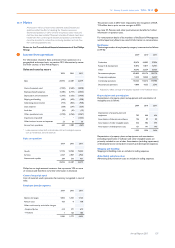
3Income taxes
The tax expense on income before tax amounted to EUR 283 million
(2010: EUR 499 million, 2009: EUR 99 million).
The components of income before taxes and income tax expense are
as follows:
2009 2010 2011
Netherlands 206 952 244
Foreign 292 1,007 (753)
Income before taxes of continuing
operations 498 1,959 (509)
Netherlands:
Current tax income (expense) (17) (103) (40)
Deferred tax income (expense) (72) (144) 44
(89) (247) 4
Foreign:
Current tax income (expense) (201) (210) (360)
Deferred tax income (expense) 189 (52) 149
(12) (262) (211)
Income tax expense of continuing
operations (99) (499) (283)
Income tax expense of discontinued
operations (2) (10) 76
Income tax expense (101) (509) (207)
The components of income tax expense are as follows:
2009 2010 2011
Current tax expense (239) (357) (390)
Prior year results 21 44 (10)
Current tax income (expense) (218) (313) (400)
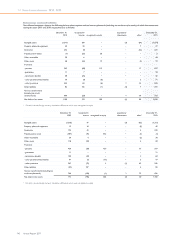
2009 2010 2011
Recognition of previously unrecognized
tax losses 1 9 20
Current year tax loss carried forwards
not realized (60) (55) (89)
Temporary differences (not recognized)
recognized 2 (5) 15
Prior year results 119 (16) 31
Tax rate changes − (4) (1)
Origination and reversal of temporary
differences 55 (125) 217
Deferred tax income (expense) 117 (196) 193
Philips’ operations are subject to income taxes in various foreign
jurisdictions. The statutory income tax rates vary from 10.0% to 42.3%,
which results in a difference between the weighted average statutory
income tax rate and the Netherlands’ statutory income tax rate of
25.0% (2010: 25.5%; 2009: 25.5%).
A reconciliation of the weighted average statutory income tax rate to
the effective income tax rate of continuing operations is as follows:
in %
2009 2010 2011
Weighted average statutory income tax
rate 18.1 26.6 55.4
Tax rate effect of:
Changes related to:
- utilization of previously reserved loss
carryforwards (0.2) (0.5) 3.9
- new loss carryforwards not expected
to be realized 9.3 2.1 (17.6)
- addition (releases) (0.4) 0.3 2.9
Non-tax-deductible impairment charges 2.8 − (98.3)
Non-taxable income (23.3) (7.5) 11.1
Non-tax-deductible expenses 23.6 3.9 (22.4)
Withholding and other taxes 4.2 1.2 (4.5)
Tax rate changes (0.1) 0.2 (0.1)
Prior year tax results (28.1) (1.4) 4.5
Tax expenses due to other liabilities 7.5 (0.4) (9.0)
Tax incentives and other 6.5 1.0 18.5
Effective tax rate 19.9 25.5 (55.6)
The weighted average statutory income tax rate increased in 2011
compared to 2010, as a consequence of a change in the country mix of
income tax rates, as well as a significant change of the mix of profits
and losses in the various countries, which resulted in a loss recorded
for the period.
The effective income tax rate is negative because a tax charge was
recorded despite a loss recorded for the period, mainly attributable to
non-tax-deductible impairment charges.