Philips 2011 Annual Report Download - page 151
Download and view the complete annual report
Please find page 151 of the 2011 Philips annual report below. You can navigate through the pages in the report by either clicking on the pages listed below, or by using the keyword search tool below to find specific information within the annual report.-
 1
1 -
2
-
3
-
4
-
5
-
6
-
7
-
8
-
9
-
10
-
11
-
12
-
13
-
14
-
15
-
16
-
17
-
18
-
19
-
20
-
21
-
22
-
23
-
24
-
25
-
26
-
27
-
28
-
29
-
30
-
31
-
32
-
33
-
34
-
35
-
36
-
37
-
38
-
39
-
40
-
41
-
42
-
43
-
44
-
45
-
46
-
47
-
48
-
49
-
50
-
51
-
52
-
53
-
54
-
55
-
56
-
57
-
58
-
59
-
60
-
61
-
62
-
63
-
64
-
65
-
66
-
67
-
68
-
69
-
70
-
71
-
72
-
73
-
74
-
75
-
76
-
77
-
78
-
79
-
80
-
81
-
82
-
83
-
84
-
85
-
86
-
87
-
88
-
89
-
90
-
91
-
92
-
93
-
94
-
95
-
96
-
97
-
98
-
99
-
100
-
101
-
102
-
103
-
104
-
105
-
106
-
107
-
108
-
109
-
110
-
111
-
112
-
113
-
114
-
115
-
116
-
117
-
118
-
119
-
120
-
121
-
122
-
123
-
124
-
125
-
126
-
127
-
128
-
129
-
130
-
131
-
132
-
133
-
134
-
135
-
136
-
137
-
138
-
139
-
140
-
 141
141 -
 142
142 -
 143
143 -
 144
144 -
 145
145 -
 146
146 -
 147
147 -
 148
148 -
 149
149 -
 150
150 -
 151
151 -
 152
152 -
 153
153 -
 154
154 -
 155
155 -
 156
156 -
 157
157 -
 158
158 -
 159
159 -
 160
160 -
 161
161 -
162
-
163
-
164
-
165
-
166
-
167
-
168
-
169
-
170
-
171
-
172
-
173
-
174
-
175
-
176
-
177
-
178
-
179
-
180
-
181
-
182
-
183
-
184
-
185
-
186
-
187
-
188
-
189
-
190
-
191
-
192
-
193
-
194
-
195
-
196
-
197
-
198
-
199
-
200
-
201
-
202
-
203
-
204
-
205
-
206
-
207
-
208
-
209
-
210
-
211
-
212
-
213
-
214
-
215
-
216
-
217
-
218
-
219
-
220
-
221
-
222
-
223
-
224
-
225
-
226
-
227
-
228
 |
 |

12 Group financial statements 12.11 - 12.11 16 17 18
Annual Report 2011 151
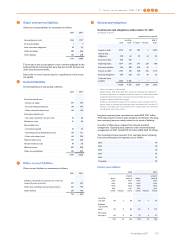
16 Other current assets
Other current assets include prepaid expenses of EUR 351 million
(2010: EUR 348 million).
17 Current receivables
The accounts receivable, net, per sector are as follows:
2010 2011
Healthcare 1,848 1,882
Consumer Lifestyle 1,082 1,111
Lighting 1,072 1,119
Group Management & Services 102 59
4,104 4,171
The aging analysis of accounts receivable, net, is set out below:
2010 2011
current 3,439 3,553
overdue 1-30 days 297 290
overdue 31-180 days 283 234
overdue > 180 days 85 94
4,104 4,171
A large part of overdue trade accounts receivable relates to public
sector customers with slow payment approval processes. The
allowance for doubtful accounts receivable has been primarily
established for receivables that are past due.
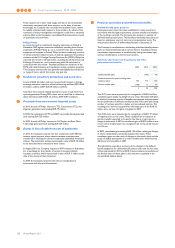
The changes in the allowance for doubtful accounts receivable are as
follows:
2009 2010 2011
Balance as of January 1 280 261 264
Additions charged to income 23 24 20
Deductions from allowance1) (58) (37) (31)
Other movements 16 162) (20)
Balance as of December 31 261 2642) 233
1) Write-offs for which an allowance was previously provided
2) Adjusted to reflect a change in the other movements
18 Shareholders’ equity
Objectives, policies and processes for managing capital
For information regarding our objectives, policies and processes for
managing capital, please refer to chapter 15, Reconciliation of non-
GAAP information, of this Annual Report, which is deemed
incorporated and repeated herein by reference.
Common shares
As of December 31, 2011, the issued and fully paid share capital consists
of 1,008,975,445 common shares, each share having a par value of EUR
0.20.
In May 2011, Philips settled a dividend of EUR 0.75 per common share,
representing a total value of EUR 711 million. Shareholders could elect
for a cash dividend or a share dividend. Approximately 63% of the
shareholders elected for a share dividend, resulting in the issuance of
22,896,661 new common shares. The settlement of the cash dividend
resulted in a payment of EUR 263 million.
Preference shares
The ‘Stichting Preferente Aandelen Philips’ has been granted the right
to acquire preference shares in the Company. Such right has not been
exercised. As a means to protect the Company and its stakeholders
against an unsolicited attempt to acquire (de facto) control of the
Company, the General Meeting of Shareholders in 1989 adopted
amendments to the Company’s articles of association that allow the
Board of Management and the Supervisory Board to issue (rights to
acquire) preference shares to a third party. As of December 31, 2011,
no preference shares have been issued.
Option rights/restricted shares
The Company has granted stock options on its common shares and
rights to receive common shares in the future (see note 30, Share-
based compensation).
Treasury shares
In connection with the Company’s share repurchase programs, shares
which have been repurchased and are held in treasury for (i) delivery
upon exercise of options and convertible personnel debentures and
under restricted share programs and employee share purchase
programs, and (ii) capital reduction purposes, are accounted for as a
reduction of shareholders’ equity. Treasury shares are recorded at
cost, representing the market price on the acquisition date. When
issued, shares are removed from treasury shares on a first-in, first-
out (FIFO) basis.
Any difference between the cost and the cash received at the time
treasury shares are issued, is recorded in capital in excess of par value,
except in the situation in which the cash received is lower than cost
and capital in excess of par has been depleted.
The following transactions took place resulting from employee option
and share plans:
2010 2011
Shares acquired 15,237 32,484
Average market price EUR 25.35 EUR 19.94
Amount paid − EUR 1 million
Shares delivered 5,397,514 4,200,181
Average market price EUR 23.99 EUR 20.54
Amount received EUR 71 million EUR 87 million
Total shares in treasury at
year-end 37,720,402 33,552,705
Total cost EUR 1,051 million EUR 965 million
In order to reduce share capital, the following transactions took place in
2011 (in 2010 there were no transactions to reduce share capital):
2010 2011
Shares acquired − 47,475,840
Average market price − EUR 14.74
Amount paid − EUR 700 million
Reduction of capital stock − −
Total shares in treasury at
year-end 1,851,998 49,327,838
Total cost EUR 25 million EUR 725 million
Dividend distributed from retained earnings
A proposal will be submitted to the General Meeting of Shareholders
to pay a dividend of EUR 0.75 per common share, in cash or shares at
the option of the shareholder, from retained earnings.
Limitations in the distribution of shareholders’ equity
Pursuant to Dutch law, limitations exist relating to the distribution of
shareholders’ equity of EUR 1,413 million (2010: EUR 1,500 million).
Such limitations relate to common shares of EUR 202 million (2010:
EUR 197 million) as well as to legal reserves required by Dutch law