Philips 2011 Annual Report Download - page 37
Download and view the complete annual report
Please find page 37 of the 2011 Philips annual report below. You can navigate through the pages in the report by either clicking on the pages listed below, or by using the keyword search tool below to find specific information within the annual report.-
 1
1 -
2
-
3
-
4
-
5
-
6
-
7
-
8
-
9
-
10
-
11
-
12
-
13
-
14
-
15
-
16
-
17
-
18
-
19
-
20
-
21
-
22
-
23
-
24
-
25
-
26
-
 27
27 -
 28
28 -
 29
29 -
 30
30 -
 31
31 -
 32
32 -
 33
33 -
 34
34 -
 35
35 -
 36
36 -
 37
37 -
 38
38 -
 39
39 -
 40
40 -
 41
41 -
 42
42 -
 43
43 -
 44
44 -
 45
45 -
 46
46 -
 47
47 -
48
-
49
-
50
-
51
-
52
-
53
-
54
-
55
-
56
-
57
-
58
-
59
-
60
-
61
-
62
-
63
-
64
-
65
-
66
-
67
-
68
-
69
-
70
-
71
-
72
-
73
-
74
-
75
-
76
-
77
-
78
-
79
-
80
-
81
-
82
-
83
-
84
-
85
-
86
-
87
-
88
-
89
-
90
-
91
-
92
-
93
-
94
-
95
-
96
-
97
-
98
-
99
-
100
-
101
-
102
-
103
-
104
-
105
-
106
-
107
-
108
-
109
-
110
-
111
-
112
-
113
-
114
-
115
-
116
-
117
-
118
-
119
-
120
-
121
-
122
-
123
-
124
-
125
-
126
-
127
-
128
-
129
-
130
-
131
-
132
-
133
-
134
-
135
-
136
-
137
-
138
-
139
-
140
-
141
-
142
-
143
-
144
-
145
-
146
-
147
-
148
-
149
-
150
-
151
-
152
-
153
-
154
-
155
-
156
-
157
-
158
-
159
-
160
-
161
-
162
-
163
-
164
-
165
-
166
-
167
-
168
-
169
-
170
-
171
-
172
-
173
-
174
-
175
-
176
-
177
-
178
-
179
-
180
-
181
-
182
-
183
-
184
-
185
-
186
-
187
-
188
-
189
-
190
-
191
-
192
-
193
-
194
-
195
-
196
-
197
-
198
-
199
-
200
-
201
-
202
-
203
-
204
-
205
-
206
-
207
-
208
-
209
-
210
-
211
-
212
-
213
-
214
-
215
-
216
-
217
-
218
-
219
-
220
-
221
-
222
-
223
-
224
-
225
-
226
-
227
-
228
 |
 |

5 Group performance 5.1.3 - 5.1.3
Annual Report 2011 37
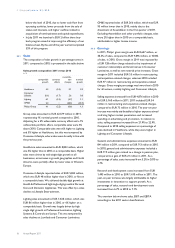
Sales, EBIT and EBITA 2011
in millions of euros unless otherwise stated
sales EBIT1) % EBITA1) %
Healthcare 8,852 93 1.1 1,145 12.9
Consumer Lifestyle 5,823 392 6.7 472 8.1
Lighting 7,638 (362) (4.7) 445 5.8
GM&S 266 (392) − (382) −
Philips Group 22,579 (269) (1.2) 1,680 7.4
1) For a reconciliation to the most directly comparable GAAP measures, see
chapter 15, Reconciliation of non-GAAP information, of this Annual Report
Sales, EBIT and EBITA 2010
in millions of euros unless otherwise stated
sales EBIT1) % EBITA1) %
Healthcare 8,601 922 10.7 1,186 13.8
Consumer Lifestyle 5,775 679 11.8 718 12.4
Lighting 7,552 695 9.2 869 11.5
GM&S 359 (216) − (211) −
Philips Group 22,287 2,080 9.3 2,562 11.5
1) For a reconciliation to the most directly comparable GAAP measures, see
chapter 15, Reconciliation of non-GAAP information, of this Annual Report
In 2011, EBIT decreased by EUR 2,349 million compared
to 2010, to a loss of EUR 269 million, or minus 1.2% of
sales. 2011 included EUR 163 million in restructuring and
acquisition-related charges, compared to EUR 203 million
in 2010. The year-on-year decrease was mainly driven by
goodwill impairments of EUR 1,355 million, lower gross
margin percentages in Lighting and Consumer Lifestyle,
and lower EBIT in Group Management & Services.
Amortization of intangibles, excluding software,
capitalized product development and impairment-
related charges, amounted to EUR 594 million in 2011,
compared to EUR 482 million in 2010.
EBITA decreased from EUR 2,562 million, or 11.5% of
sales, in 2010 to EUR 1,680 million, or 7.4% of sales, in
2011. The decrease in EBITA was attributable to all
sectors.
Healthcare
EBITA decreased from EUR 1,186 million, or 13.8% of
sales, in 2010 to EUR 1,145 million, or 12.9% of sales, in
2011. EBITA improved in Customer Services, Home
Healthcare Solutions and PCCI, but was more than offset
by lower results in Imaging Systems. Restructuring and
acquisition-related charges totaled EUR 20 million,
compared to EUR 77 million in 2010.
Consumer Lifestyle
EBITA decreased from EUR 718 million, or 12.4% of sales,
in 2010 to EUR 472 million, or 8.1% of sales, in 2011.
Restructuring and acquisition-related charges amounted
to EUR 54 million in 2011, compared to EUR 31 million
in 2010. The year-on-year EBITA decrease was largely due
to lower sales, particularly in Lifestyle Entertainment,
higher investments in advertising and promotion, as well
as lower license income. EBITA was higher than in 2010
in Health & Wellness, while in all other businesses it
declined.
Lighting
EBITA decreased from EUR 869 million, or 11.5% of sales,
in 2010 to EUR 445 million, or 5.8% of sales, in 2011.
Restructuring and acquisition-related charges amounted
to EUR 66 million in 2011, compared to EUR 97 million
in 2010. The decrease in EBITA was largely attributable
to lower gross margin due to raw material price increases,
as well as step-ups in investments related to growth.
Group Management & Services
EBITA decreased from a loss of EUR 211 million in 2010
to a loss of EUR 382 million in 2011. EBITA in 2010
included a EUR 119 million gain related to a change in
pension plan. 2011 results included a EUR 21 million gain
from a change in a pension plan, and EUR 23 million in
restructuring charges. The year-on-year EBITA decrease
was largely attributable to higher pension costs,
provisions for legal and environmental claims, and
investments related to the Accelerate! program.
For further information regarding the performance of the
sectors, see chapter 6, Sector performance, of this Annual
Report.
5.1.3 Pensions
The net periodic pension costs of defined-benefit pension
plans amounted to a cost of EUR 18 million in 2011,
compared to a credit of EUR 105 million in 2010. The
defined-contribution pension cost amounted to EUR 120
million, EUR 6 million higher than in 2010.
In 2011, further steps were taken to manage the financial
exposure to defined benefit plans. One of our major plans
was frozen and the active members were transferred to
a defined contribution plan, causing a curtailment gain. In
the same plan, a prior-service gain was recognized due to
retired members opting for a one-off benefit increase in
exchange for future indexation. The overall curtailment
gain for 2011 was EUR 18 million and the prior-service
cost gain was EUR 20 million.