Philips 2011 Annual Report Download - page 56
Download and view the complete annual report
Please find page 56 of the 2011 Philips annual report below. You can navigate through the pages in the report by either clicking on the pages listed below, or by using the keyword search tool below to find specific information within the annual report.-
 1
1 -
2
-
3
-
4
-
5
-
6
-
7
-
8
-
9
-
10
-
11
-
12
-
13
-
14
-
15
-
16
-
17
-
18
-
19
-
20
-
21
-
22
-
23
-
24
-
25
-
26
-
27
-
28
-
29
-
30
-
31
-
32
-
33
-
34
-
35
-
36
-
37
-
38
-
39
-
40
-
41
-
42
-
43
-
44
-
45
-
 46
46 -
 47
47 -
 48
48 -
 49
49 -
 50
50 -
 51
51 -
 52
52 -
 53
53 -
 54
54 -
 55
55 -
 56
56 -
 57
57 -
 58
58 -
 59
59 -
 60
60 -
 61
61 -
 62
62 -
 63
63 -
 64
64 -
 65
65 -
 66
66 -
67
-
68
-
69
-
70
-
71
-
72
-
73
-
74
-
75
-
76
-
77
-
78
-
79
-
80
-
81
-
82
-
83
-
84
-
85
-
86
-
87
-
88
-
89
-
90
-
91
-
92
-
93
-
94
-
95
-
96
-
97
-
98
-
99
-
100
-
101
-
102
-
103
-
104
-
105
-
106
-
107
-
108
-
109
-
110
-
111
-
112
-
113
-
114
-
115
-
116
-
117
-
118
-
119
-
120
-
121
-
122
-
123
-
124
-
125
-
126
-
127
-
128
-
129
-
130
-
131
-
132
-
133
-
134
-
135
-
136
-
137
-
138
-
139
-
140
-
141
-
142
-
143
-
144
-
145
-
146
-
147
-
148
-
149
-
150
-
151
-
152
-
153
-
154
-
155
-
156
-
157
-
158
-
159
-
160
-
161
-
162
-
163
-
164
-
165
-
166
-
167
-
168
-
169
-
170
-
171
-
172
-
173
-
174
-
175
-
176
-
177
-
178
-
179
-
180
-
181
-
182
-
183
-
184
-
185
-
186
-
187
-
188
-
189
-
190
-
191
-
192
-
193
-
194
-
195
-
196
-
197
-
198
-
199
-
200
-
201
-
202
-
203
-
204
-
205
-
206
-
207
-
208
-
209
-
210
-
211
-
212
-
213
-
214
-
215
-
216
-
217
-
218
-
219
-
220
-
221
-
222
-
223
-
224
-
225
-
226
-
227
-
228
 |
 |

5 Group performance 5.4.5 - 5.4.5
56 Annual Report 2011
health and safety, environmental impact, ethics and
management systems. The Declaration is signed by
suppliers as part of their purchasing contracts.
Philips uses a risk assessment to select suppliers in risk
countries for inclusion in the audit program. During the
audits, compliance to all sections of the Declaration is
reviewed and in case of non-compliance the
implementation of corrective actions is monitored.
In addition to the audit program, we developed specific
projects and stakeholder engagement activities to help
improve the sustainability performance of our suppliers,
such as on improving on their worker-management
dialogue, carbon footprinting, and compliance with the
Conflict minerals provisions. For more details, see section
14.6, Supplier indicators, of this Annual Report.
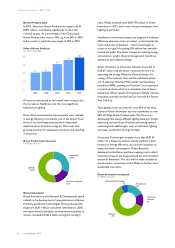
2011 supplier audits
Philips conducted 212 full scope audits in 2011, including
9 joint audits conducted on behalf of Philips and other
EICC member companies. During these audits an external
company visited the supplier’s site in risk countries for a
2 to 12 man-days audit during which compliance with all
sections of the Supplier Sustainability Declaration was
assessed. As in previous years the majority of the audits
were done in China, representing a major part of our
supply base. The total number of full scope audits
conducted since we started the program in 2005 now
exceeds 1,800. This number includes repeated audits,
since we execute a full scope audit at our risk suppliers
every 3 years.
The most frequently observed areas of non-compliance
were:
• Working hours, wages and benefits: excessive
overtime, continual seven-day work weeks, record-
keeping of standard and overtime working hours, no
payment of overtime premiums
• Emergency preparedness: inadequate fire detection and
suppression systems, blocked or insufficient emergency
exits
• Occupational safety: worker exposure to safety
hazards, e.g. electrical shocks
• Lack of adequate management systems to safeguard
compliance to the EICC code for labor and ethics,
health and safety, and environment
Accumulative number of initial and continual
conformance audits
1,800
1,200
600
0
150
2005
365
2006
166
2007
277
2008
360
2009
273
2010
212
2011
1,803
total
Distribution of supplier audits by country
China
151
India
16
Indonesia
7
Mexico
6
Brazil
28
Other
4
To track improvements, Philips measures the ‘compliance
rate’ for the identified risk suppliers, being the percentage
of risk suppliers that was recently audited and has
resolved all major non compliances. During 2011 we
achieved a compliance rate of 72%. For more details on
audit results, please refer to section 14.6, Supplier
indicators, of this Annual Report.
‘Conflict’ minerals: issues further down the chain
Conflict minerals can come from many souces around the
world including mines in the Democratic Republic of the
Congo (DRC). Philips is concerned about the situation in
the east of the DRC where proceeds from the extractives
sector are used to finance rebel conflicts in the region.
Philips is committed to address this issue through the
means and influencing mechanisms available to us, even
though Philips does not directly source minerals from the
DRC and mines are typically seven or more tiers removed
from our direct suppliers. During 2011 we worked with
100 priority suppliers to raise awareness and start supply
chain investigations to determine the origin of the metals
in our products, resulting in the identification of over 100
smelters in our supply chain that process these metals.
For more details, please refer to section 14.6, Supplier
indicators, of this Annual Report.