Philips 2011 Annual Report Download - page 160
Download and view the complete annual report
Please find page 160 of the 2011 Philips annual report below. You can navigate through the pages in the report by either clicking on the pages listed below, or by using the keyword search tool below to find specific information within the annual report.-
 1
1 -
2
-
3
-
4
-
5
-
6
-
7
-
8
-
9
-
10
-
11
-
12
-
13
-
14
-
15
-
16
-
17
-
18
-
19
-
20
-
21
-
22
-
23
-
24
-
25
-
26
-
27
-
28
-
29
-
30
-
31
-
32
-
33
-
34
-
35
-
36
-
37
-
38
-
39
-
40
-
41
-
42
-
43
-
44
-
45
-
46
-
47
-
48
-
49
-
50
-
51
-
52
-
53
-
54
-
55
-
56
-
57
-
58
-
59
-
60
-
61
-
62
-
63
-
64
-
65
-
66
-
67
-
68
-
69
-
70
-
71
-
72
-
73
-
74
-
75
-
76
-
77
-
78
-
79
-
80
-
81
-
82
-
83
-
84
-
85
-
86
-
87
-
88
-
89
-
90
-
91
-
92
-
93
-
94
-
95
-
96
-
97
-
98
-
99
-
100
-
101
-
102
-
103
-
104
-
105
-
106
-
107
-
108
-
109
-
110
-
111
-
112
-
113
-
114
-
115
-
116
-
117
-
118
-
119
-
120
-
121
-
122
-
123
-
124
-
125
-
126
-
127
-
128
-
129
-
130
-
131
-
132
-
133
-
134
-
135
-
136
-
137
-
138
-
139
-
140
-
141
-
142
-
143
-
144
-
145
-
146
-
147
-
148
-
149
-
 150
150 -
 151
151 -
 152
152 -
 153
153 -
 154
154 -
 155
155 -
 156
156 -
 157
157 -
 158
158 -
 159
159 -
 160
160 -
 161
161 -
 162
162 -
 163
163 -
 164
164 -
 165
165 -
 166
166 -
 167
167 -
 168
168 -
 169
169 -
 170
170 -
171
-
172
-
173
-
174
-
175
-
176
-
177
-
178
-
179
-
180
-
181
-
182
-
183
-
184
-
185
-
186
-
187
-
188
-
189
-
190
-
191
-
192
-
193
-
194
-
195
-
196
-
197
-
198
-
199
-
200
-
201
-
202
-
203
-
204
-
205
-
206
-
207
-
208
-
209
-
210
-
211
-
212
-
213
-
214
-
215
-
216
-
217
-
218
-
219
-
220
-
221
-
222
-
223
-
224
-
225
-
226
-
227
-
228
 |
 |

12 Group financial statements 12.11 - 12.11
160 Annual Report 2011
Cumulative amount of actuarial (gains) and losses recognized in the
Consolidated statements of comprehensive income (pre tax): EUR
3,909 million (2010: EUR 3,291 million).
Plan assets in the Netherlands
The Company’s pension plan asset allocation in the Netherlands at
December 31 was as follows:
in %
2010 2011
actual actual
Matching portfolio: 70 72
- Debt securities 70 72
Return portfolio: 30 28
- Equity securities 18 16
- Real estate 5 5
- Other 7 7
100 100
The objective of the Matching portfolio is to match part of the interest
rate sensitivity of the plan’s real pension liabilities. The Matching
portfolio is mainly invested in euro-denominated government bonds
and investment grade debt securities and derivatives. Leverage or
gearing is not permitted. The size of the Matching portfolio is targeted
to be at least 64% of the fair value of the plan’s real pension obligations
(on the assumption of 2% inflation). The objective of the Return
portfolio is to maximize returns within well-specified risk constraints.
The long-term rate of return on total plan assets is expected to be 5.4%
per annum, based on expected long-term returns on debt securities,
equity securities and real estate of 4.5%, 9.0% and 8% respectively.
Philips Pension Fund in the Netherlands
On November 13, 2007, various officials, on behalf of the Public
Prosecutor’s office in the Netherlands, visited a number of offices of
the Philips Pension Fund and the Company in relation to a widespread
investigation into potential fraud in the real estate sector. The Company
was notified that one former employee and one employee of an affiliate
of the Company had been detained. This affiliate, Philips Real Estate
Investment Management B.V., managed the real estate portfolio of the
Philips Pension Fund between 2002 and 2008. The investigation by the
public prosecutor concerns the potential involvement of (former)
employees of a number of Dutch companies with respect to fraud in
the context of certain real estate transactions. Neither the Philips
Pension Fund nor any Philips entity is a suspect in this investigation. The
Philips Pension Fund and Philips are cooperating with the authorities
and have also conducted their own investigation. Formal notifications
of suspected fraud have been filed with the public prosecutor against
the (former) employees concerned and with our insurers.
Furthermore, actions have been taken to claim damages from the
responsible individuals and legal entities. This has resulted in a number
of settlements. At this time it is not possible to assess the outcome of
this matter nor the potential consequences. At present, it is
management’s assessment that this matter will not cause a decline in
plan assets nor an increase in pension costs in any material respect.
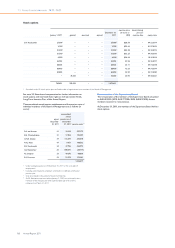
Plan assets in other countries
The Company’s pension plan asset allocation in other countries at
December 31 is shown in the table below. This table also shows the
target allocation for 2012:
in %
2010 2011 2012
actual actual target
Equity securities 23 16 18
Debt securities 70 75 80
Real estate 1 1 1
Other 6 8 1
100 100 100
Plan assets in 2011 do not include property occupied or financial
instruments held by the Philips Group.
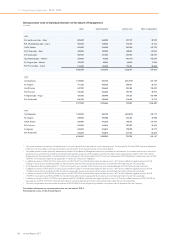
Pension expense of defined-benefit plans recognized in the Consolidated statements of income:
2009 2010 2011
Netherlands other total Netherlands other total Netherlands other total
Service cost 107 75 182 92 77 169 127 73 200
Interest cost on the
defined-benefit obligation 532 395 927 521 418 939 557 404 961
Expected return on plan assets (758) (343) (1,101) (743) (344) (1,087) (713) (389) (1,102)
Prior-service cost − (3) (3) − (119) (119) − (20) (20)
Settlement loss (gain) − − − − (6) (6) − (1) (1)
Curtailment loss (gain) − (5) (5) − (1) (1) − (18) (18)
Other 2 1 3 1 1 2 (1) 1 −
Net periodic cost (income) (117) 120 3 (129) 26 (103) (30) 50 20
of which
discontinued operations 3 − 3 2 − 2 2 − 2