Philips 2011 Annual Report Download - page 128
Download and view the complete annual report
Please find page 128 of the 2011 Philips annual report below. You can navigate through the pages in the report by either clicking on the pages listed below, or by using the keyword search tool below to find specific information within the annual report.-
 1
1 -
2
-
3
-
4
-
5
-
6
-
7
-
8
-
9
-
10
-
11
-
12
-
13
-
14
-
15
-
16
-
17
-
18
-
19
-
20
-
21
-
22
-
23
-
24
-
25
-
26
-
27
-
28
-
29
-
30
-
31
-
32
-
33
-
34
-
35
-
36
-
37
-
38
-
39
-
40
-
41
-
42
-
43
-
44
-
45
-
46
-
47
-
48
-
49
-
50
-
51
-
52
-
53
-
54
-
55
-
56
-
57
-
58
-
59
-
60
-
61
-
62
-
63
-
64
-
65
-
66
-
67
-
68
-
69
-
70
-
71
-
72
-
73
-
74
-
75
-
76
-
77
-
78
-
79
-
80
-
81
-
82
-
83
-
84
-
85
-
86
-
87
-
88
-
89
-
90
-
91
-
92
-
93
-
94
-
95
-
96
-
97
-
98
-
99
-
100
-
101
-
102
-
103
-
104
-
105
-
106
-
107
-
108
-
109
-
110
-
111
-
112
-
113
-
114
-
115
-
116
-
117
-
 118
118 -
 119
119 -
 120
120 -
 121
121 -
 122
122 -
 123
123 -
 124
124 -
 125
125 -
 126
126 -
 127
127 -
 128
128 -
 129
129 -
 130
130 -
 131
131 -
 132
132 -
 133
133 -
 134
134 -
 135
135 -
 136
136 -
 137
137 -
 138
138 -
139
-
140
-
141
-
142
-
143
-
144
-
145
-
146
-
147
-
148
-
149
-
150
-
151
-
152
-
153
-
154
-
155
-
156
-
157
-
158
-
159
-
160
-
161
-
162
-
163
-
164
-
165
-
166
-
167
-
168
-
169
-
170
-
171
-
172
-
173
-
174
-
175
-
176
-
177
-
178
-
179
-
180
-
181
-
182
-
183
-
184
-
185
-
186
-
187
-
188
-
189
-
190
-
191
-
192
-
193
-
194
-
195
-
196
-
197
-
198
-
199
-
200
-
201
-
202
-
203
-
204
-
205
-
206
-
207
-
208
-
209
-
210
-
211
-
212
-
213
-
214
-
215
-
216
-
217
-
218
-
219
-
220
-
221
-
222
-
223
-
224
-
225
-
226
-
227
-
228
 |
 |

12 Group financial statements 12.9 - 12.9
128 Annual Report 2011
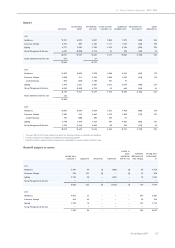
Main countries
sales1,2) tangible and intangible assets
2011
Netherlands 691 908
United States 6,373 8,473
China 2,102 1,126
Germany 1,431 252
France 1,046 97
Japan 911 618
Brazil 694 119
Other countries 9,331 2,433
22,579 14,026
Assets classified as held for sale 287
14,313
2010
Netherlands 661 1,1093)
United States 6,430 9,693
China 1,864 785
Germany 1,436 282
France 1,134 100
Japan 856 568
Brazil 654 148
Other countries 9,252 2,693
22,287 15,378
Assets classified as held for sale3) 120
15,498
2009
Netherlands 727 1,193
United States 6,106 9,198
China 1,442 684
Germany 1,416 288
France 1,151 111
Japan 678 489
Brazil 595 128
Other countries 7,977 2,684
20,092 14,775
1) The years 2009 and 2010 are restated to present the Television business as discontinued operations
2) The sales are reported based on country of destination
3) Revised to reflect a property, plant and equipment reclassification to assets classified as held for sale