Philips 2011 Annual Report Download - page 144
Download and view the complete annual report
Please find page 144 of the 2011 Philips annual report below. You can navigate through the pages in the report by either clicking on the pages listed below, or by using the keyword search tool below to find specific information within the annual report.-
 1
1 -
2
-
3
-
4
-
5
-
6
-
7
-
8
-
9
-
10
-
11
-
12
-
13
-
14
-
15
-
16
-
17
-
18
-
19
-
20
-
21
-
22
-
23
-
24
-
25
-
26
-
27
-
28
-
29
-
30
-
31
-
32
-
33
-
34
-
35
-
36
-
37
-
38
-
39
-
40
-
41
-
42
-
43
-
44
-
45
-
46
-
47
-
48
-
49
-
50
-
51
-
52
-
53
-
54
-
55
-
56
-
57
-
58
-
59
-
60
-
61
-
62
-
63
-
64
-
65
-
66
-
67
-
68
-
69
-
70
-
71
-
72
-
73
-
74
-
75
-
76
-
77
-
78
-
79
-
80
-
81
-
82
-
83
-
84
-
85
-
86
-
87
-
88
-
89
-
90
-
91
-
92
-
93
-
94
-
95
-
96
-
97
-
98
-
99
-
100
-
101
-
102
-
103
-
104
-
105
-
106
-
107
-
108
-
109
-
110
-
111
-
112
-
113
-
114
-
115
-
116
-
117
-
118
-
119
-
120
-
121
-
122
-
123
-
124
-
125
-
126
-
127
-
128
-
129
-
130
-
131
-
132
-
133
-
 134
134 -
 135
135 -
 136
136 -
 137
137 -
 138
138 -
 139
139 -
 140
140 -
 141
141 -
 142
142 -
 143
143 -
 144
144 -
 145
145 -
 146
146 -
 147
147 -
 148
148 -
 149
149 -
 150
150 -
 151
151 -
 152
152 -
 153
153 -
 154
154 -
155
-
156
-
157
-
158
-
159
-
160
-
161
-
162
-
163
-
164
-
165
-
166
-
167
-
168
-
169
-
170
-
171
-
172
-
173
-
174
-
175
-
176
-
177
-
178
-
179
-
180
-
181
-
182
-
183
-
184
-
185
-
186
-
187
-
188
-
189
-
190
-
191
-
192
-
193
-
194
-
195
-
196
-
197
-
198
-
199
-
200
-
201
-
202
-
203
-
204
-
205
-
206
-
207
-
208
-
209
-
210
-
211
-
212
-
213
-
214
-
215
-
216
-
217
-
218
-
219
-
220
-
221
-
222
-
223
-
224
-
225
-
226
-
227
-
228
 |
 |

6 7 12 Group financial statements 12.11 - 12.11
144 Annual Report 2011
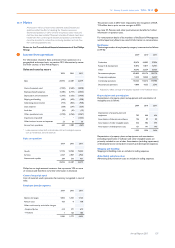
6Earnings per share
Earnings per share
2009 2010 2011
Income (loss) from continuing operations 476 1,478 (776)
Income attributable to non-controlling interest 14 6 4
Income (loss) from continuing operations attributable to
shareholders 462 1,472 (780)
Income (loss) from discontinued operations (52) (26) (515)
Net income (loss) attributable to shareholders 410 1,446 (1,295)
Weighted average number of common shares outstanding (after
deduction of treasury shares) during the year 926,546,3281) 940,528,1071) 951,646,557
Plus incremental shares from assumed conversions of:
Options and restricted share rights 3,555,559 7,548,916 4,309,777
Convertible debentures − 314,874 173,890
Dilutive potential common shares 3,555,559 7,863,790 4,483,667
Adjusted weighted average number of shares (after deduction of
treasury shares) during the year 930,101,8871) 948,391,8971) 956,130,224
Basic earnings per common share in euros 2)
Income (loss) from continuing operations 0.51 1.57 (0.82)
Income (loss) from discontinued operations (0.06) (0.03) (0.54)
Income (loss) from continuing operations attributable to
shareholders 0.50 1.57 (0.82)
Net income (loss) attributable to shareholders 0.44 1.54 (1.36)
Diluted earnings per common share in euros2,3,4)
Income (loss) from continuing operations 0.51 1.56 (0.82)
Income (loss) from discontinued operations (0.06) (0.03) (0.54)
Income (loss) from continuing operations attributable to
shareholders 0.50 1.55 (0.82)
Net income (loss) attributable to shareholders 0.44 1.52 (1.36)
Dividend distributed per common share in euros 0.70 0.70 0.75
1) Adjusted to make 2009 and 2010 comparable for the bonus shares issued in April 2010 (398 thousand) and April 2011 (667 thousand)
2) The effect on income of items affecting earnings per share is considered immaterial
3) In 2011, 2010 and 2009, respectively 37 million, 36 million and 52 million securities that could potentially dilute basic EPS were not included in the computation of dilutive EPS
because the effect would have been antidilutive for the periods presented
4) The incremental shares from assumed conversion are not taken into account in the periods for which there is a loss attributable to shareholders, as the effect would be antidilutive
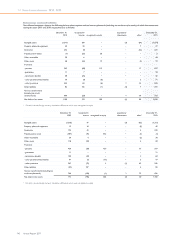
7Acquisitions and divestments
2011
During 2011, Philips entered into six acquisitions. These acquisitions
involved an aggregated purchase price of EUR 498 million and have been
accounted for using the acquisition method. Measured on an annualized
basis, the aggregated impact of the six acquisitions on group Sales,
Income from operations (excluding charges related to goodwill
impairment), Net income and Net income per common share (on a
fully diluted basis) is not material in respect of IFRS 3 disclosure
requirements.
The divestments in 2011 involved an aggregated consideration of EUR
57 million and were therefore deemed immaterial in respect of IFRS 3
disclosure requirements.
2010
During 2010, Philips entered into 11 acquisitions. These acquisitions
involved an aggregated purchase price of EUR 235 million and have been
accounted for using the acquisition method. Measured on an annualized
basis, the aggregated impact of the 11 acquisitions on group Sales,
Income from operations, Net income and Net income per common
share (on a fully diluted basis) is not material in respect of IFRS 3
disclosure requirements.
On March 9, 2010, Philips divested 9.4% of the shares in TPV
Technology Ltd. (TPV). The TPV shares were sold to CEIEC Ltd., a
Hong Kong-based technology company, for a cash consideration of EUR
98 million. The transaction resulted in a gain of EUR 5 million, which
was reported under Results relating to Investments in Associates.
The remaining divestments in 2010 involved an aggregated
consideration of EUR 22 million and were therefore deemed immaterial
in respect of IFRS 3 disclosure requirements.
2009
During 2009, Philips entered into a number of acquisitions and
completed several divestments.