Philips 2011 Annual Report Download - page 43
Download and view the complete annual report
Please find page 43 of the 2011 Philips annual report below. You can navigate through the pages in the report by either clicking on the pages listed below, or by using the keyword search tool below to find specific information within the annual report.-
 1
1 -
2
-
3
-
4
-
5
-
6
-
7
-
8
-
9
-
10
-
11
-
12
-
13
-
14
-
15
-
16
-
17
-
18
-
19
-
20
-
21
-
22
-
23
-
24
-
25
-
26
-
27
-
28
-
29
-
30
-
31
-
32
-
 33
33 -
 34
34 -
 35
35 -
 36
36 -
 37
37 -
 38
38 -
 39
39 -
 40
40 -
 41
41 -
 42
42 -
 43
43 -
 44
44 -
 45
45 -
 46
46 -
 47
47 -
 48
48 -
 49
49 -
 50
50 -
 51
51 -
 52
52 -
 53
53 -
54
-
55
-
56
-
57
-
58
-
59
-
60
-
61
-
62
-
63
-
64
-
65
-
66
-
67
-
68
-
69
-
70
-
71
-
72
-
73
-
74
-
75
-
76
-
77
-
78
-
79
-
80
-
81
-
82
-
83
-
84
-
85
-
86
-
87
-
88
-
89
-
90
-
91
-
92
-
93
-
94
-
95
-
96
-
97
-
98
-
99
-
100
-
101
-
102
-
103
-
104
-
105
-
106
-
107
-
108
-
109
-
110
-
111
-
112
-
113
-
114
-
115
-
116
-
117
-
118
-
119
-
120
-
121
-
122
-
123
-
124
-
125
-
126
-
127
-
128
-
129
-
130
-
131
-
132
-
133
-
134
-
135
-
136
-
137
-
138
-
139
-
140
-
141
-
142
-
143
-
144
-
145
-
146
-
147
-
148
-
149
-
150
-
151
-
152
-
153
-
154
-
155
-
156
-
157
-
158
-
159
-
160
-
161
-
162
-
163
-
164
-
165
-
166
-
167
-
168
-
169
-
170
-
171
-
172
-
173
-
174
-
175
-
176
-
177
-
178
-
179
-
180
-
181
-
182
-
183
-
184
-
185
-
186
-
187
-
188
-
189
-
190
-
191
-
192
-
193
-
194
-
195
-
196
-
197
-
198
-
199
-
200
-
201
-
202
-
203
-
204
-
205
-
206
-
207
-
208
-
209
-
210
-
211
-
212
-
213
-
214
-
215
-
216
-
217
-
218
-
219
-
220
-
221
-
222
-
223
-
224
-
225
-
226
-
227
-
228
 |
 |

5 Group performance 5.2 - 5.2.1
Annual Report 2011 43
5.2 Liquidity and
capital resources
Prior years results and cash flows have been restated to reflect the effect of
classifying the Television business as discontinued operations in 2011.
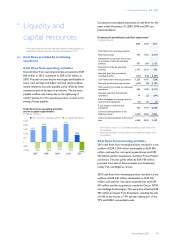
5.2.1 Cash flows provided by continuing
operations
Cash flows from operating activities
Net cash flow from operating activities amounted to EUR
836 million in 2011, compared to EUR 2,121 million in
2010. The year-on-year decline was largely attributable to
lower cash earnings and higher working capital outflow,
mainly related to accounts payable, partly offset by lower
inventories and an increase in provisions. The accounts
payable outflow was mainly due to the tightening of
vendor payments in the operating sectors, as well as the
timing of taxes payable.
Cash flows from operating activities
and net capital expenditures
in millions of euros
■-cash flows from operating activities--■-net capital expenditures
2,500
2,000
1,500
1,000
500
0
(500)
(1,000)
1,431
(783)
2007
1,896
(786)
2008
1,391
(628)
2009
2,121
(765)
2010
836
(944)
2011
Condensed consolidated statements of cash flows for the
years ended December 31, 2009, 2010 and 2011 are
presented below:
Condensed consolidated cash flow statements1)
in millions of euros
2009 2010 2011
Cash flows from operating activities:
Net income (loss) 424 1,452 (1,291)
Adjustments to reconcile net income
to net cash provided by operating
activities 967 669 2,127
Net cash provided by operating
activities 1,391 2,121 836
Net cash (used for) provided by
investing activities (165) (646) (1,364)
Cash flows before financing activities2) 1,226 1,475 (528)
Net cash used for financing activities (544) (95) (1,787)
Cash (used for) provided by continuing
operations 682 1,380 (2,315)
Net cash (used for) discontinued
operations 99 (22) (364)
Effect of changes in exchange rates on
cash and cash equivalents (15) 89 (7)
Total change in cash and cash
equivalents 766 1,447 (2,686)
Cash and cash equivalents at the
beginning of year 3,620 4,386 5,833
Cash and cash equivalents at the end of
year 4,386 5,833 3,147
1) Please refer to section 12.7, Consolidated statements of cash flows, of this
Annual Report
2) Please refer to chapter 15, Reconciliation of non-GAAP information, of this
Annual Report
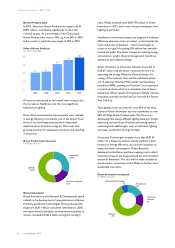
Cash flows from investing activities
2011 cash flows from investing activities resulted in a net
outflow of EUR 1,364 million, attributable to EUR 944
million cash used for net capital expenditures and EUR
552 million used for acquisitions, mainly for Povos, Preethi
and Sectra. This was partly offset by EUR 106 million
proceeds from sale of financial assets and divestment,
mainly TCL and Digimarc shares.
2010 cash flows from investing activities resulted in a net
outflow of EUR 646 million, attributable to EUR 765
million cash used for net capital expenditures and EUR
241 million used for acquisitions, mainly for Discus, NCW
and medSage Technologies. This was partly offset by EUR
385 million proceeds from divestment, including the sale
of 9.4% of the shares in TPV and the redemption of the
TPV and CBAY convertible bonds.