Philips 2011 Annual Report Download - page 147
Download and view the complete annual report
Please find page 147 of the 2011 Philips annual report below. You can navigate through the pages in the report by either clicking on the pages listed below, or by using the keyword search tool below to find specific information within the annual report.-
 1
1 -
2
-
3
-
4
-
5
-
6
-
7
-
8
-
9
-
10
-
11
-
12
-
13
-
14
-
15
-
16
-
17
-
18
-
19
-
20
-
21
-
22
-
23
-
24
-
25
-
26
-
27
-
28
-
29
-
30
-
31
-
32
-
33
-
34
-
35
-
36
-
37
-
38
-
39
-
40
-
41
-
42
-
43
-
44
-
45
-
46
-
47
-
48
-
49
-
50
-
51
-
52
-
53
-
54
-
55
-
56
-
57
-
58
-
59
-
60
-
61
-
62
-
63
-
64
-
65
-
66
-
67
-
68
-
69
-
70
-
71
-
72
-
73
-
74
-
75
-
76
-
77
-
78
-
79
-
80
-
81
-
82
-
83
-
84
-
85
-
86
-
87
-
88
-
89
-
90
-
91
-
92
-
93
-
94
-
95
-
96
-
97
-
98
-
99
-
100
-
101
-
102
-
103
-
104
-
105
-
106
-
107
-
108
-
109
-
110
-
111
-
112
-
113
-
114
-
115
-
116
-
117
-
118
-
119
-
120
-
121
-
122
-
123
-
124
-
125
-
126
-
127
-
128
-
129
-
130
-
131
-
132
-
133
-
134
-
135
-
136
-
 137
137 -
 138
138 -
 139
139 -
 140
140 -
 141
141 -
 142
142 -
 143
143 -
 144
144 -
 145
145 -
 146
146 -
 147
147 -
 148
148 -
 149
149 -
 150
150 -
 151
151 -
 152
152 -
 153
153 -
 154
154 -
 155
155 -
 156
156 -
 157
157 -
158
-
159
-
160
-
161
-
162
-
163
-
164
-
165
-
166
-
167
-
168
-
169
-
170
-
171
-
172
-
173
-
174
-
175
-
176
-
177
-
178
-
179
-
180
-
181
-
182
-
183
-
184
-
185
-
186
-
187
-
188
-
189
-
190
-
191
-
192
-
193
-
194
-
195
-
196
-
197
-
198
-
199
-
200
-
201
-
202
-
203
-
204
-
205
-
206
-
207
-
208
-
209
-
210
-
211
-
212
-
213
-
214
-
215
-
216
-
217
-
218
-
219
-
220
-
221
-
222
-
223
-
224
-
225
-
226
-
227
-
228
 |
 |

12 Group financial statements 12.11 - 12.11 9
Annual Report 2011 147
Capitalized interest included in capital expenditures is not significant.
Changes in expected useful lives and residual values have an insignificant
effect on depreciation in current and future years.
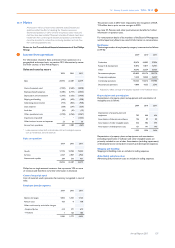
9Goodwill
The changes in 2010 and 2011 were as follows:
2010 2011
Balance as of January 1:
Cost 8,021 8,742
Amortization / Impairments (659) (707)
Book value 7,362 8,035
Changes in book value:
Acquisitions 84 225
Divestments − (8)
Impairments − (1,355)
Transfer to assets classified as held for sale − (5)
Translation differences 589 124
Balance as of December 31:
Cost 8,742 9,224
Amortization / Impairments (707) (2,208)
Book value 8,035 7,016
Acquisitions in 2011 include mainly the goodwill related to the
acquisition of Povos (kitchen appliances) for EUR 102 million, Sectra
(mammography business operations) EUR 41 million and Optimum
Lighting EUR 30 million.
Acquisitions in 2010 include goodwill related to the acquisition of
Discus for EUR 47 million and several other companies. In addition,
goodwill changed due to the finalization of purchase price accounting
related to acquisitions in the prior year.
For impairment testing, goodwill is allocated to (groups of) cash-
generating units (typically one level below operating sector level), which
represent the lowest level at which the goodwill is monitored internally
for management purposes.
Goodwill allocated to the cash-generating units Respiratory Care and
Sleep Management, Imaging Systems, Patient Care & Clinical Informatics
and Professional Luminaires is considered to be significant in
comparison to the total book value of goodwill for the Group at
December 31, 2011. The amounts allocated are presented below:
2010 2011
Respiratory Care and Sleep Management 2,209 1,779
Imaging Systems 1,422 1,507
Patient Care & Clinical Informatics 1,297 1,360
Professional Luminaires 1,485 1,229
The basis of the recoverable amount used in the annual (performed in
the second quarter) and trigger-based impairment tests is the value in
use. Key assumptions used in the impairment tests for the units in the
table above were sales growth rates, adjusted income from operations
and the rates used for discounting the projected cash flows. These cash
flow projections were determined using management’s internal
forecasts that cover an initial period from 2011 to 2015 that matches
the period used for our strategic review. Projections were extrapolated
with stable or declining growth rates for a period of 5 years, after which
a terminal value was calculated. For terminal value calculation, growth
rates were capped at a historical long-term average growth rate.
The sales growth rates and margins used to estimate cash flows are
based on past performance, external market growth assumptions and
industry long-term growth averages.
Adjusted income from operations in all units is expected to increase
over the projection period as a result of volume growth and cost
efficiencies.
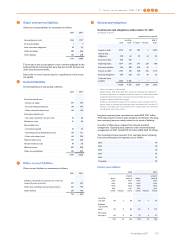
Cash flow projections of Respiratory Care & Sleep Management,
Imaging Systems, Patient Care & Clinical Informatics and Professional
Luminaires for 2011 were based on the following key assumptions
(based on the annual impairment test performed in the second quarter):
in %
compound sales growth rate1)
initial
forecast
period
extra-
polation
period
terminal
value
pre-tax
discount
rates
Respiratory Care and Sleep
Management 7.6 5.6 2.7 11.5
Imaging Systems 7.2 4.7 2.7 11.8
Patient Care & Clinical
Informatics 8.2 5.6 2.7 13.4
Professional Luminaires 9.5 6.1 2.7 13.6
1) Compound sales growth rate is the annualized steady growth rate over the
forecast period
The assumptions used for the 2010 cash flow projections were as
follows:
in %
compound sales growth rate1)
forecast
period
extra-
polation
period
terminal
value
pre-tax
discount
rates
Respiratory Care and Sleep
Management 9.4 5.0 2.7 10.2
Imaging Systems 5.2 4.0 2.7 11.1
Patient Care & Clinical
Informatics 6.5 5.4 2.7 12.1
Professional Luminaires 11.3 7.2 2.7 14.0
1) Compound sales growth rate is the annualized steady growth rate over the
forecast period
Based on the annual test in 2011 the recoverable amounts for certain
cash-generating units were estimated to be lower than the carrying
amounts, and therefore impairment was identified as follows:
Cash-generating unit
reportable
segment
amount of
impairment
Respiratory Care and Sleep Management Healthcare 450
Home Monitoring Healthcare 374
Consumer Luminaires Lighting 227
Professional Luminaires Lighting 304
Compared to the previous impairment test, for the four cash-
generating units mentioned above, there has been no change in the
organization structure which impacts how goodwill is allocated to these
cash-generating units.