Philips 2011 Annual Report Download - page 54
Download and view the complete annual report
Please find page 54 of the 2011 Philips annual report below. You can navigate through the pages in the report by either clicking on the pages listed below, or by using the keyword search tool below to find specific information within the annual report.-
 1
1 -
2
-
3
-
4
-
5
-
6
-
7
-
8
-
9
-
10
-
11
-
12
-
13
-
14
-
15
-
16
-
17
-
18
-
19
-
20
-
21
-
22
-
23
-
24
-
25
-
26
-
27
-
28
-
29
-
30
-
31
-
32
-
33
-
34
-
35
-
36
-
37
-
38
-
39
-
40
-
41
-
42
-
43
-
 44
44 -
 45
45 -
 46
46 -
 47
47 -
 48
48 -
 49
49 -
 50
50 -
 51
51 -
 52
52 -
 53
53 -
 54
54 -
 55
55 -
 56
56 -
 57
57 -
 58
58 -
 59
59 -
 60
60 -
 61
61 -
 62
62 -
 63
63 -
 64
64 -
65
-
66
-
67
-
68
-
69
-
70
-
71
-
72
-
73
-
74
-
75
-
76
-
77
-
78
-
79
-
80
-
81
-
82
-
83
-
84
-
85
-
86
-
87
-
88
-
89
-
90
-
91
-
92
-
93
-
94
-
95
-
96
-
97
-
98
-
99
-
100
-
101
-
102
-
103
-
104
-
105
-
106
-
107
-
108
-
109
-
110
-
111
-
112
-
113
-
114
-
115
-
116
-
117
-
118
-
119
-
120
-
121
-
122
-
123
-
124
-
125
-
126
-
127
-
128
-
129
-
130
-
131
-
132
-
133
-
134
-
135
-
136
-
137
-
138
-
139
-
140
-
141
-
142
-
143
-
144
-
145
-
146
-
147
-
148
-
149
-
150
-
151
-
152
-
153
-
154
-
155
-
156
-
157
-
158
-
159
-
160
-
161
-
162
-
163
-
164
-
165
-
166
-
167
-
168
-
169
-
170
-
171
-
172
-
173
-
174
-
175
-
176
-
177
-
178
-
179
-
180
-
181
-
182
-
183
-
184
-
185
-
186
-
187
-
188
-
189
-
190
-
191
-
192
-
193
-
194
-
195
-
196
-
197
-
198
-
199
-
200
-
201
-
202
-
203
-
204
-
205
-
206
-
207
-
208
-
209
-
210
-
211
-
212
-
213
-
214
-
215
-
216
-
217
-
218
-
219
-
220
-
221
-
222
-
223
-
224
-
225
-
226
-
227
-
228
 |
 |

5 Group performance 5.4.3 - 5.4.3
54 Annual Report 2011
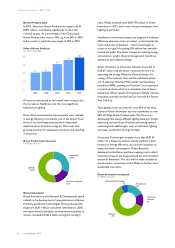
Diversity and inclusion
In 2011, Philips made progress towards its targets relating
to the diversity of the company’s executive population.
The share of female executives increased to 13%
compared to 11% in 2010 – two percentage points off the
2012 target of 15% female executives. While the
Healthcare and Consumer Lifestyle sector traditionally
had a better representation of women at senior and
executive grades, 2011 saw Philips successfully start to
tackle the concern on low numbers of female executives
in the Lighting sector. Their share approximately doubled
to 14% in 2011.
Female Executives
as a % of total
14
7
0
8
2007
10
2008
10
2009
11
2010
13
2011
Of a total of 68 newly appointed executives, resulting
from internal promotions, 17% were women. Almost 30%
of newly hired executives were female, demonstrating our
commitment to increasing gender diversity in the
company’s leadership beyond the internally available
pipeline. With Carole Wainaina, who joined Philips in
2011 as the new Chief HR Officer, Philips once more has a
woman on its Executive Committee.
In 2011, Philips also achieved an increase of the share of
women especially in senior professional and management
roles, clear proof points of the companies ambition to
drive gender diversity more broadly and ensure a
sustainable internal pipeline of highly qualified women
from junior level upwards.
In line with the growing importance of BRIC countries as
part of the Philips business, the share of executives with
Brazilian, Russian, Indian and Chinese nationality
increased from 5% in 2010 to over 8% in 2011. The 2012
target is 10% of the total executive population. In 2011,
Patrick Kung, Market Leader Greater China, was
appointed to the Executive Committee. Overall, the 567
executives of Philips represent 31 different nationalities.
Developing our people
Our learning strategy focuses on building skills that are
strongly aligned with business needs. In 2011, we
continued to streamline our classroom offerings in close
alignment with businesses and functions to focus on their
key priorities. The second important driver of our
learning strategy is providing employees with free and
unlimited access to a wide range of online learning options
to drive their personal development and growth.
Participation in these priority programs and free unlimited
online courses increased significantly, with over 39,000
enrollments compared with 20,000 in 2010. Functional
Core Curricula enrollment was over 25,000 in 2011, an
increase from 15,500 in 2010. These Core Curricula have
been developed for functions such as Marketing, Sales,
Customer Services, IT, HRM, Supply Management and
Finance. Moreover, we had over 30,000 employees
participating in various ethics and compliance related
training sessions.
Our flagship leadership development programs for our
talent pool are run in collaboration with leading business
schools with a strong emphasis on blended learning. In
2011, our Inspire program facilitated the completion of 18
project assignments by 147 high potentials. Top potentials
in the Octagon program completed 8 business projects.
These business projects are sponsored by senior business
leaders and focus on Healthcare and Well-being, targeting
growth geographies, the US and South Africa.
Our leadership development programs will be extended
and upgraded to reflect business needs and the need for
local customization, building on the Accelerate! leadership
behaviors and culture change.
In line with our ‘Grow with Philips’ program, 76% of newly
appointed executives were promotions and 24% external
hires.
Health and safety
We regret to report two fatalities in 2011, of which one
was related to a safety accident and one to a traffic
accident whilst commuting.
In 2011, we recorded 405 Lost Workday Injuries cases,
i.e. injury cases where the injured person is unable to
work the day after the injury. This was a 16% decrease
compared with 2010. The rate of Lost Workday Injuries
also decreased to 0.38 per 100 FTEs, compared to 0.50
in 2010.