Philips 2011 Annual Report Download - page 5
Download and view the complete annual report
Please find page 5 of the 2011 Philips annual report below. You can navigate through the pages in the report by either clicking on the pages listed below, or by using the keyword search tool below to find specific information within the annual report.-
 1
1 -
 2
2 -
 3
3 -
 4
4 -
 5
5 -
 6
6 -
 7
7 -
 8
8 -
 9
9 -
 10
10 -
 11
11 -
 12
12 -
 13
13 -
 14
14 -
 15
15 -
 16
16 -
17
-
18
-
19
-
20
-
21
-
22
-
23
-
24
-
25
-
26
-
27
-
28
-
29
-
30
-
31
-
32
-
33
-
34
-
35
-
36
-
37
-
38
-
39
-
40
-
41
-
42
-
43
-
44
-
45
-
46
-
47
-
48
-
49
-
50
-
51
-
52
-
53
-
54
-
55
-
56
-
57
-
58
-
59
-
60
-
61
-
62
-
63
-
64
-
65
-
66
-
67
-
68
-
69
-
70
-
71
-
72
-
73
-
74
-
75
-
76
-
77
-
78
-
79
-
80
-
81
-
82
-
83
-
84
-
85
-
86
-
87
-
88
-
89
-
90
-
91
-
92
-
93
-
94
-
95
-
96
-
97
-
98
-
99
-
100
-
101
-
102
-
103
-
104
-
105
-
106
-
107
-
108
-
109
-
110
-
111
-
112
-
113
-
114
-
115
-
116
-
117
-
118
-
119
-
120
-
121
-
122
-
123
-
124
-
125
-
126
-
127
-
128
-
129
-
130
-
131
-
132
-
133
-
134
-
135
-
136
-
137
-
138
-
139
-
140
-
141
-
142
-
143
-
144
-
145
-
146
-
147
-
148
-
149
-
150
-
151
-
152
-
153
-
154
-
155
-
156
-
157
-
158
-
159
-
160
-
161
-
162
-
163
-
164
-
165
-
166
-
167
-
168
-
169
-
170
-
171
-
172
-
173
-
174
-
175
-
176
-
177
-
178
-
179
-
180
-
181
-
182
-
183
-
184
-
185
-
186
-
187
-
188
-
189
-
190
-
191
-
192
-
193
-
194
-
195
-
196
-
197
-
198
-
199
-
200
-
201
-
202
-
203
-
204
-
205
-
206
-
207
-
208
-
209
-
210
-
211
-
212
-
213
-
214
-
215
-
216
-
217
-
218
-
219
-
220
-
221
-
222
-
223
-
224
-
225
-
226
-
227
-
228
 |
 |

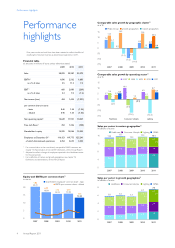
Performance highlights
Annual Report 2011 5
Net income (loss)
in millions of euros ■-in value----as a % of sales
6,000
4,000
2,000
0
(2,000)
23.6
4,880
2007
(0.4)
(92)
2008
2.1
424
2009
6.5
1,452
2010 (5.7)
(1,291)
2011
EBIT and EBITA1)
in millions of euros
■-EBIT--■
■-EBITA----EBITA as a % of sales
3,000
2,500
2,000
1,500
1,000
500
0
(500)
1,781
227
2,008
9.7
2007
296
691
987
4.6
2008
660
436
1,096
5.5
2009
2,080
482
2,562
11.5
2010
(269)
1,949
1,680
7.4
2011
Operating cash flows
in millions of euros
■-net capital expenditures_■
■-free cash flows1)
■-operating cash flows_--free cash flows as a % of sales
3,000
2,000
1,000
0
(1,000)
(2,000)
1,431
(783)
648
3.1
2007
1,896
(786)
1,110
5.1
2008
1,391
(628)
763
3.8
2009
2,121
(765)
1,356
6.1
2010
836
(944)
(108)
(0.5)
2011
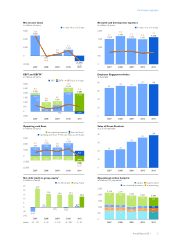
Net debt (cash) to group equity1)
in billions of euros ■-net debt (cash)--■-group equity
25
20
15
10
5
0
(5)
(10)
(5.2)
21.9
-31 : 131
2007
0.6
15.6
4 : 96
2008
(0.1)
14.6
-1 : 101
2009
(1.2)
15.1
-8 : 108
2010
0.7
12.4
5 : 95
2011
ratio:
Research and development expenses
in millions of euros ■-in value----as a % of sales
2,000
1,500
1,000
500
0
7.3
1,508
2007
7.8
1,684
2008
7.7
1,542
2009
6.7
1,493
2010
7.1
1,610
2011
Employee Engagement Index
% favorable
80
60
40
20
0
67
2007
72
2008
71
2009
77
2010
76
2011
Sales of Green Products
as a % of total sales
40
30
20
10
0
21
2007
22
2008
31
2009
36
2010
39
2011
Operational carbon footprint
in kilotons CO2-equivalent ■-logistics_■-business travel
■-non-industrial operations_■-manufacturing
2,500
2,000
1,500
1,000
500
0
2007
714
276
211
947
2,148
2008
706
265
181
959
2,111
2009
627
220
174
909
1,930
2010
672
247
159
767
1,845
2011
657
256
155
703
1,771