Philips 2011 Annual Report Download - page 126
Download and view the complete annual report
Please find page 126 of the 2011 Philips annual report below. You can navigate through the pages in the report by either clicking on the pages listed below, or by using the keyword search tool below to find specific information within the annual report.-
 1
1 -
2
-
3
-
4
-
5
-
6
-
7
-
8
-
9
-
10
-
11
-
12
-
13
-
14
-
15
-
16
-
17
-
18
-
19
-
20
-
21
-
22
-
23
-
24
-
25
-
26
-
27
-
28
-
29
-
30
-
31
-
32
-
33
-
34
-
35
-
36
-
37
-
38
-
39
-
40
-
41
-
42
-
43
-
44
-
45
-
46
-
47
-
48
-
49
-
50
-
51
-
52
-
53
-
54
-
55
-
56
-
57
-
58
-
59
-
60
-
61
-
62
-
63
-
64
-
65
-
66
-
67
-
68
-
69
-
70
-
71
-
72
-
73
-
74
-
75
-
76
-
77
-
78
-
79
-
80
-
81
-
82
-
83
-
84
-
85
-
86
-
87
-
88
-
89
-
90
-
91
-
92
-
93
-
94
-
95
-
96
-
97
-
98
-
99
-
100
-
101
-
102
-
103
-
104
-
105
-
106
-
107
-
108
-
109
-
110
-
111
-
112
-
113
-
114
-
115
-
 116
116 -
 117
117 -
 118
118 -
 119
119 -
 120
120 -
 121
121 -
 122
122 -
 123
123 -
 124
124 -
 125
125 -
 126
126 -
 127
127 -
 128
128 -
 129
129 -
 130
130 -
 131
131 -
 132
132 -
 133
133 -
 134
134 -
 135
135 -
 136
136 -
137
-
138
-
139
-
140
-
141
-
142
-
143
-
144
-
145
-
146
-
147
-
148
-
149
-
150
-
151
-
152
-
153
-
154
-
155
-
156
-
157
-
158
-
159
-
160
-
161
-
162
-
163
-
164
-
165
-
166
-
167
-
168
-
169
-
170
-
171
-
172
-
173
-
174
-
175
-
176
-
177
-
178
-
179
-
180
-
181
-
182
-
183
-
184
-
185
-
186
-
187
-
188
-
189
-
190
-
191
-
192
-
193
-
194
-
195
-
196
-
197
-
198
-
199
-
200
-
201
-
202
-
203
-
204
-
205
-
206
-
207
-
208
-
209
-
210
-
211
-
212
-
213
-
214
-
215
-
216
-
217
-
218
-
219
-
220
-
221
-
222
-
223
-
224
-
225
-
226
-
227
-
228
 |
 |

12 Group financial statements 12.9 - 12.9
126 Annual Report 2011
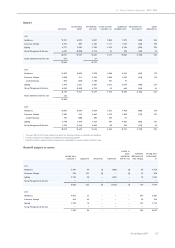
12.9 Information by sector and main country
in millions of euros
Information by sector and main country
Sectors
sales
sales including
intercompany
research and
development
expenses
income from
operations
income from
operations as a % of
sales
cash flow before
financing
activities
2011
Healthcare 8,852 8,866 (740) 93 1.1 770
Consumer Lifestyle 5,823 5,834 (313) 392 6.7 (38)
Lighting 7,638 7,652 (409) (362) (4.7) 254
Group Management & Services 266 517 (148) (392) − (1,514)
Inter-sector eliminations (290)
22,579 22,579 (1,610) (269) (1.2) (528)
2010
Healthcare 8,601 8,611 (698) 922 10.7 1,139
Consumer Lifestyle 5,775 5,788 (282) 679 11.8 493
Lighting 7,552 7,563 (355) 695 9.2 590
Group Management & Services 359 530 (158) (216) − (747)
Inter-sector eliminations (205)
22,287 22,287 (1,493) 2,080 9.3 1,475
2009
Healthcare 7,839 7,850 (679) 593 7.6 889
Consumer Lifestyle 5,370 5,386 (300) 436 8.1 574
Lighting 6,546 6,554 (351) (16) (0.2) 624
Group Management & Services 337 455 (212) (353) − (861)
Inter-sector eliminations (153)
20,092 20,092 (1,542) 660 3.3 1,226
The years 2009 and 2010 are restated to present the Television business as discontinued operations
Our sectors are organized based on the nature of the products and
services. The four sectors comprise Healthcare, Consumer Lifestyle,
Lighting and Group Management & Services as shown in the table above.
A short description of these sectors is as follows:
Healthcare: Consists of the following businesses - Imaging Systems,
Home Healthcare Solutions, Patient Care & Clinical Informatics, and
Customer Services.
Consumer Lifestyle: Consists of the following businesses - Lifestyle
Entertainment, Personal Care, Domestic Appliances, and Health &
Wellness.
Lighting: Consists of the following businesses - Lamps, Professional
Luminaires, Consumer Luminaires, Lighting Systems & Controls,
Automotive Lighting, and Lumileds.
Group Management & Services: Consists of the corporate center, as
well as the overhead expenses of regional and country organizations.
Also included are the costs of Philips’ pension and other postretirement
benefit costs not directly allocated to the other sectors.
Transactions between the sectors mainly relate to services provided
by the sector Group Management & Services to the other sectors. The
pricing of such transactions is determined on an arm’s length principle.