Philips 2011 Annual Report Download - page 137
Download and view the complete annual report
Please find page 137 of the 2011 Philips annual report below. You can navigate through the pages in the report by either clicking on the pages listed below, or by using the keyword search tool below to find specific information within the annual report.-
 1
1 -
2
-
3
-
4
-
5
-
6
-
7
-
8
-
9
-
10
-
11
-
12
-
13
-
14
-
15
-
16
-
17
-
18
-
19
-
20
-
21
-
22
-
23
-
24
-
25
-
26
-
27
-
28
-
29
-
30
-
31
-
32
-
33
-
34
-
35
-
36
-
37
-
38
-
39
-
40
-
41
-
42
-
43
-
44
-
45
-
46
-
47
-
48
-
49
-
50
-
51
-
52
-
53
-
54
-
55
-
56
-
57
-
58
-
59
-
60
-
61
-
62
-
63
-
64
-
65
-
66
-
67
-
68
-
69
-
70
-
71
-
72
-
73
-
74
-
75
-
76
-
77
-
78
-
79
-
80
-
81
-
82
-
83
-
84
-
85
-
86
-
87
-
88
-
89
-
90
-
91
-
92
-
93
-
94
-
95
-
96
-
97
-
98
-
99
-
100
-
101
-
102
-
103
-
104
-
105
-
106
-
107
-
108
-
109
-
110
-
111
-
112
-
113
-
114
-
115
-
116
-
117
-
118
-
119
-
120
-
121
-
122
-
123
-
124
-
125
-
126
-
 127
127 -
 128
128 -
 129
129 -
 130
130 -
 131
131 -
 132
132 -
 133
133 -
 134
134 -
 135
135 -
 136
136 -
 137
137 -
 138
138 -
 139
139 -
 140
140 -
 141
141 -
 142
142 -
 143
143 -
 144
144 -
 145
145 -
 146
146 -
 147
147 -
148
-
149
-
150
-
151
-
152
-
153
-
154
-
155
-
156
-
157
-
158
-
159
-
160
-
161
-
162
-
163
-
164
-
165
-
166
-
167
-
168
-
169
-
170
-
171
-
172
-
173
-
174
-
175
-
176
-
177
-
178
-
179
-
180
-
181
-
182
-
183
-
184
-
185
-
186
-
187
-
188
-
189
-
190
-
191
-
192
-
193
-
194
-
195
-
196
-
197
-
198
-
199
-
200
-
201
-
202
-
203
-
204
-
205
-
206
-
207
-
208
-
209
-
210
-
211
-
212
-
213
-
214
-
215
-
216
-
217
-
218
-
219
-
220
-
221
-
222
-
223
-
224
-
225
-
226
-
227
-
228
 |
 |

12 Group financial statements 12.10 - 12.11 1
Annual Report 2011 137
12.11 Notes
All amounts in millions of euros unless otherwise stated. Discontinued
operations reflect the effect of classifying the Television business as
discontinued operations in 2011, for which the previous years’ results and
cash flows have been restated. Movement schedules of balance sheet items
include items from continuing and discontinued operations and therefore
cannot be reconciled to income from continuing operations and cash flow
from continuing operations only.
Notes to the Consolidated financial statements of the Philips
Group
1Income from operations
For information related to Sales and Income from operations on a
geographical and sector basis, see section 12.9, Information by sector
and main country, of this Annual Report.
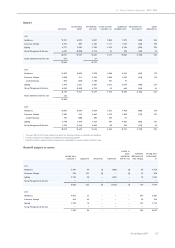
Sales and costs by nature
2009 2010 2011
Sales 20,092 22,287 22,579
Costs of materials used (7,290) (7,600) (8,098)
Employee benefit expenses (5,580) (5,777) (6,053)
Depreciation and amortization (1,395) (1,356) (1,456)
Shipping and handling (420) (422) (398)
Advertising and promotion (714) (835) (938)
Lease expense1) (338) (297) (320)
Audit fees (20) (20) (19)
Other operational costs (3,728) (3,966) (4,261)
Impairment of goodwill − − (1,355)
Other business income and expenses 53 66 50
Income from operations 660 2,080 (269)
1) Lease expense contains both minimal lease costs and contingent expense
such as maintenance, fuel and electricity
Sales composition
2009 2010 2011
Goods 17,176 18,904 19,222
Services 2,527 2,867 2,926
Licenses and royalties 389 516 431
20,092 22,287 22,579
Philips has no single external customer that represents 10% or more
of revenues and therefore no further information is disclosed.
Costs of materials used
Cost of materials used represents the inventory recognized in cost of
sales.
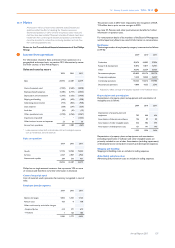
Employee benefit expenses
2009 2010 2011
Salaries and wages 4,862 5,035 5,123
Pension costs 103 8 138
Other social security and similar charges:
- Required by law 614 571 612
- Voluntary 1 163 180
5,580 5,777 6,053
The pension costs in 2010 were impacted by the recognition of EUR
119 million due to prior service cost gain in 2010.
See note 29, Pensions and other postretirement benefits for further
information on pension costs.
For remuneration details of the members of the Board of Management
and the Supervisory Board, see note 32, Information on remuneration.
Employees
The average number of employees by category is summarized as follows
(in FTEs):
20091) 20101) 2011
Production 58,674 56,005 57,804
Research & development 10,876 11,817 12,941
Other 34,343 32,354 33,033
Permanent employees 103,893 100,176 103,778
Temporary employees 9,430 13,040 16,207
Continuing operations 113,323 113,216 119,985
Discontinued operations 4,800 4,355 3,545
1) Adjusted to reflect a change of employees reported in the Healthcare sector
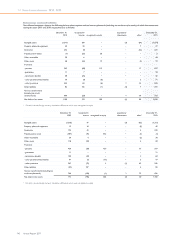
Depreciation and amortization
Depreciation of property, plant and equipment and amortization of
intangibles are as follows:
2009 2010 2011
Depreciation of property, plant and
equipment 702 644 634
Amortization of internal-use software 106 89 82
Amortization of other intangible assets 436 482 594
Amortization of development costs 151 141 146
1,395 1,356 1,456
Depreciation of property, plant and equipment and amortization
(including impairment) of software and other intangible assets are
primarily included in cost of sales. Amortization (including impairment)
of development cost is included in research and development expenses.
Shipping and handling
Shipping and handling costs are included in selling expenses.
Advertising and promotion
Advertising and promotion costs are included in selling expenses.