Philips 2011 Annual Report Download - page 143
Download and view the complete annual report
Please find page 143 of the 2011 Philips annual report below. You can navigate through the pages in the report by either clicking on the pages listed below, or by using the keyword search tool below to find specific information within the annual report.-
 1
1 -
2
-
3
-
4
-
5
-
6
-
7
-
8
-
9
-
10
-
11
-
12
-
13
-
14
-
15
-
16
-
17
-
18
-
19
-
20
-
21
-
22
-
23
-
24
-
25
-
26
-
27
-
28
-
29
-
30
-
31
-
32
-
33
-
34
-
35
-
36
-
37
-
38
-
39
-
40
-
41
-
42
-
43
-
44
-
45
-
46
-
47
-
48
-
49
-
50
-
51
-
52
-
53
-
54
-
55
-
56
-
57
-
58
-
59
-
60
-
61
-
62
-
63
-
64
-
65
-
66
-
67
-
68
-
69
-
70
-
71
-
72
-
73
-
74
-
75
-
76
-
77
-
78
-
79
-
80
-
81
-
82
-
83
-
84
-
85
-
86
-
87
-
88
-
89
-
90
-
91
-
92
-
93
-
94
-
95
-
96
-
97
-
98
-
99
-
100
-
101
-
102
-
103
-
104
-
105
-
106
-
107
-
108
-
109
-
110
-
111
-
112
-
113
-
114
-
115
-
116
-
117
-
118
-
119
-
120
-
121
-
122
-
123
-
124
-
125
-
126
-
127
-
128
-
129
-
130
-
131
-
132
-
 133
133 -
 134
134 -
 135
135 -
 136
136 -
 137
137 -
 138
138 -
 139
139 -
 140
140 -
 141
141 -
 142
142 -
 143
143 -
 144
144 -
 145
145 -
 146
146 -
 147
147 -
 148
148 -
 149
149 -
 150
150 -
 151
151 -
 152
152 -
 153
153 -
154
-
155
-
156
-
157
-
158
-
159
-
160
-
161
-
162
-
163
-
164
-
165
-
166
-
167
-
168
-
169
-
170
-
171
-
172
-
173
-
174
-
175
-
176
-
177
-
178
-
179
-
180
-
181
-
182
-
183
-
184
-
185
-
186
-
187
-
188
-
189
-
190
-
191
-
192
-
193
-
194
-
195
-
196
-
197
-
198
-
199
-
200
-
201
-
202
-
203
-
204
-
205
-
206
-
207
-
208
-
209
-
210
-
211
-
212
-
213
-
214
-
215
-
216
-
217
-
218
-
219
-
220
-
221
-
222
-
223
-
224
-
225
-
226
-
227
-
228
 |
 |

12 Group financial statements 12.11 - 12.11
Annual Report 2011 143
Consolidated statements of cash flows. Assets classified as held for sale
and liabilities directly associated with assets held for sale are reported
on the face of the balance sheet as of the moment of announcement.
The closing of the deal is expected at the end of the first quarter of
2012.
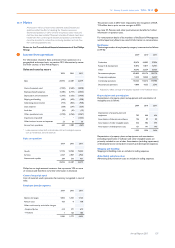
The following table summarizes the results of the Television business
included in the Consolidated statements of income as discontinued
operations.
2009 2010 2011
Sales 3,097 3,132 2,702
Costs and expenses (3,147) (3,148) (2,913)
Expected loss on sale of discontinued
operations − − (380)
Income (loss) before taxes (50) (16) (591)
Income taxes (2) (10) 76
Operational income tax (2) (10) 49
Income tax on loss on sale of discontinued
operations − − 27
Results from discontinued operations (52) (26) (515)
The total anticipated net loss related to the sale of the Television
operations amounts to approximately EUR 380 million, which mainly
comprises present value of initial contributions to be made to the TV
venture (EUR 183 million), total incurred and expected
disentanglement costs (EUR 81 million), contributed assets that will not
be fully recovered (EUR 66 million) and various smaller other items,
offset by the expected revenue associated with the sale, including the
fair value of contingent consideration and a retained 30% interest in the
TV venture.
In addition to the contributions that were agreed and recognized as
loss on onerous contract, Philips made commitments to provide further
financing to the TV venture if needed; see note 24 for more detail.
Net operational results of the discontinued operations after-tax
amounted to a loss of EUR 162 million (2010: loss of EUR 26 million;
2009: loss of EUR 52 million).
When the deal is closed and the related balance sheet positions are
transferred, the related currency translation differences and cash flow
hedges will be recognized in the income statment. At December 31,
2011, both are part of the Other reserves within Shareholders’ equity,
the amount is EUR 4 million.
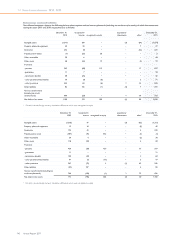
The following table presents the assets and liabilities of the Television
business, classified as held for sale and liabilities directly associated with
assets held for sale in the Consolidated balance sheets.
2011
Property, plant and equipment 46
Intangible assets including goodwill 44
Write down to fair value less costs to sell (90)
Inventories 175
Other assets 26
Assets classified as held for sale 201
Accounts payable −
Provisions (7)
Other liabilities −
Liabilities directly associated with assets held for sale (7)
Non-transferrable balance sheet positions, such as accounts receivable,
accounts payable and restructuring and warranty provisions are
reported on the respective balance sheet captions and within the net
operating capital of sector Consumer Lifestyle. For the reconciliation
of net operating capital, please refer to chapter 15, Reconciliation of
non-GAAP information, of this Annual Report.
For further information see notes, note 20, Provisions and note 24,
Contractual obligations.
Other assets classified as held for sale
Other assets classified as held for sale (December 31, 2011: EUR 350
million, December 31, 2010: EUR 120 million) and liabilities directly
associated with assets classified as held for sale (December 31, 2011:
EUR 54 million, December 31, 2010: nil) primarily relate to property,
plant and equipment.