Philips 2011 Annual Report Download - page 209
Download and view the complete annual report
Please find page 209 of the 2011 Philips annual report below. You can navigate through the pages in the report by either clicking on the pages listed below, or by using the keyword search tool below to find specific information within the annual report.-
 1
1 -
2
-
3
-
4
-
5
-
6
-
7
-
8
-
9
-
10
-
11
-
12
-
13
-
14
-
15
-
16
-
17
-
18
-
19
-
20
-
21
-
22
-
23
-
24
-
25
-
26
-
27
-
28
-
29
-
30
-
31
-
32
-
33
-
34
-
35
-
36
-
37
-
38
-
39
-
40
-
41
-
42
-
43
-
44
-
45
-
46
-
47
-
48
-
49
-
50
-
51
-
52
-
53
-
54
-
55
-
56
-
57
-
58
-
59
-
60
-
61
-
62
-
63
-
64
-
65
-
66
-
67
-
68
-
69
-
70
-
71
-
72
-
73
-
74
-
75
-
76
-
77
-
78
-
79
-
80
-
81
-
82
-
83
-
84
-
85
-
86
-
87
-
88
-
89
-
90
-
91
-
92
-
93
-
94
-
95
-
96
-
97
-
98
-
99
-
100
-
101
-
102
-
103
-
104
-
105
-
106
-
107
-
108
-
109
-
110
-
111
-
112
-
113
-
114
-
115
-
116
-
117
-
118
-
119
-
120
-
121
-
122
-
123
-
124
-
125
-
126
-
127
-
128
-
129
-
130
-
131
-
132
-
133
-
134
-
135
-
136
-
137
-
138
-
139
-
140
-
141
-
142
-
143
-
144
-
145
-
146
-
147
-
148
-
149
-
150
-
151
-
152
-
153
-
154
-
155
-
156
-
157
-
158
-
159
-
160
-
161
-
162
-
163
-
164
-
165
-
166
-
167
-
168
-
169
-
170
-
171
-
172
-
173
-
174
-
175
-
176
-
177
-
178
-
179
-
180
-
181
-
182
-
183
-
184
-
185
-
186
-
187
-
188
-
189
-
190
-
191
-
192
-
193
-
194
-
195
-
196
-
197
-
198
-
 199
199 -
 200
200 -
 201
201 -
 202
202 -
 203
203 -
 204
204 -
 205
205 -
 206
206 -
 207
207 -
 208
208 -
 209
209 -
 210
210 -
 211
211 -
 212
212 -
 213
213 -
 214
214 -
 215
215 -
 216
216 -
 217
217 -
 218
218 -
 219
219 -
220
-
221
-
222
-
223
-
224
-
225
-
226
-
227
-
228
 |
 |

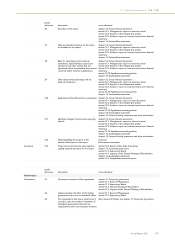
15 Reconciliation of non-GAAP information 15 - 15
Annual Report 2011 209
Net operating capital to total assets
Philips Group Healthcare Consumer Lifestyle Lighting
Group
Management
& Services
2011
Net operating capital (NOC) 10,427 8,418 887 5,020 (3,898)
Eliminate liabilities comprised in NOC:
- payables/liabilities 9,940 2,697 2,081 1,450 3,712
- intercompany accounts − 103 87 51 (241)
- provisions 2,639 287 558 227 1,567
Include assets not comprised in NOC:
- investments in associates 203 86 3 23 91
- other current financial assets − − − − −
- other non-current financial assets 346 − − − 346
- deferred tax assets 1,713 − − − 1,713
- liquid assets 3,147 − − − 3,147
28,415 11,591 3,616 6,771 6,437
Assets classified as held for sale 551
Total assets 28,966
2010
Net operating capital (NOC) 11,951 8,908 911 5,561 (3,429)1)
Eliminate liabilities comprised in NOC:
- payables/liabilities 10,009 2,603 2,509 1,485 3,412
- intercompany accounts − 54 95 68 (217)
- provisions 2,339 321 342 247 1,429
Include assets not comprised in NOC:
- investments in associates 181 76 1 18 86
- other current financial assets 6 − − − 6
- other non-current financial assets 479 − − − 479
- deferred tax assets 1,351 − − − 1,351
- liquid assets 5,833 − − − 5,833
32,149 11,962 3,858 7,379 8,950
Assets classified as held for sale1) 120
Total assets 32,269
2009
Net operating capital (NOC) 12,649 8,434 625 5,104 (1,514)
Eliminate liabilities comprised in NOC:
- payables/ liabilities 8,635 2,115 2,155 1,247 3,118
- intercompany accounts − 32 85 62 (179)
- provisions 2,450 317 420 324 1,389
Include assets not comprised in NOC:
- investments in associates 281 71 1 11 198
- other current financial assets 192 − − − 192
- other non-current financial assets 691 − − − 691
- deferred tax assets 1,243 − − − 1,243
- liquid assets 4,386 − − − 4,386
30,527 10,969 3,286 6,748 9,524
1) Revised to reflect a property, plant and equipment reclassification to assets classified as held for sale