Philips 2011 Annual Report Download - page 159
Download and view the complete annual report
Please find page 159 of the 2011 Philips annual report below. You can navigate through the pages in the report by either clicking on the pages listed below, or by using the keyword search tool below to find specific information within the annual report.-
 1
1 -
2
-
3
-
4
-
5
-
6
-
7
-
8
-
9
-
10
-
11
-
12
-
13
-
14
-
15
-
16
-
17
-
18
-
19
-
20
-
21
-
22
-
23
-
24
-
25
-
26
-
27
-
28
-
29
-
30
-
31
-
32
-
33
-
34
-
35
-
36
-
37
-
38
-
39
-
40
-
41
-
42
-
43
-
44
-
45
-
46
-
47
-
48
-
49
-
50
-
51
-
52
-
53
-
54
-
55
-
56
-
57
-
58
-
59
-
60
-
61
-
62
-
63
-
64
-
65
-
66
-
67
-
68
-
69
-
70
-
71
-
72
-
73
-
74
-
75
-
76
-
77
-
78
-
79
-
80
-
81
-
82
-
83
-
84
-
85
-
86
-
87
-
88
-
89
-
90
-
91
-
92
-
93
-
94
-
95
-
96
-
97
-
98
-
99
-
100
-
101
-
102
-
103
-
104
-
105
-
106
-
107
-
108
-
109
-
110
-
111
-
112
-
113
-
114
-
115
-
116
-
117
-
118
-
119
-
120
-
121
-
122
-
123
-
124
-
125
-
126
-
127
-
128
-
129
-
130
-
131
-
132
-
133
-
134
-
135
-
136
-
137
-
138
-
139
-
140
-
141
-
142
-
143
-
144
-
145
-
146
-
147
-
148
-
 149
149 -
 150
150 -
 151
151 -
 152
152 -
 153
153 -
 154
154 -
 155
155 -
 156
156 -
 157
157 -
 158
158 -
 159
159 -
 160
160 -
 161
161 -
 162
162 -
 163
163 -
 164
164 -
 165
165 -
 166
166 -
 167
167 -
 168
168 -
 169
169 -
170
-
171
-
172
-
173
-
174
-
175
-
176
-
177
-
178
-
179
-
180
-
181
-
182
-
183
-
184
-
185
-
186
-
187
-
188
-
189
-
190
-
191
-
192
-
193
-
194
-
195
-
196
-
197
-
198
-
199
-
200
-
201
-
202
-
203
-
204
-
205
-
206
-
207
-
208
-
209
-
210
-
211
-
212
-
213
-
214
-
215
-
216
-
217
-
218
-
219
-
220
-
221
-
222
-
223
-
224
-
225
-
226
-
227
-
228
 |
 |

12 Group financial statements 12.11 - 12.11
Annual Report 2011 159
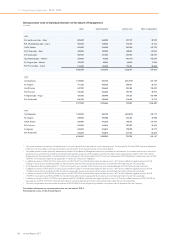
2010 2011
Netherlands other total Netherlands other total
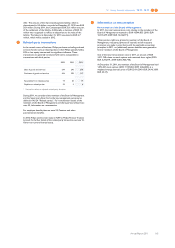
Defined-benefit obligation at the beginning of year 10,681 7,039 17,720 12,226 7,940 20,166
Service cost 92 77 169 127 73 200
Interest cost 521 418 939 557 404 961
Employee contributions − 3 3 − 3 3
Actuarial losses 1,662 593 2,255 1,307 848 2,155
Plan amendments − (113) (113) − (21) (21)
Acquisitions − − − − 3 3
Divestments − (1) (1) − − −
Settlements − (44) (44) − (52) (52)
Curtailments − (1) (1) − (19) (19)
Reclassifications − 5 5 − − −
Benefits paid (730) (432) (1,162) (724) (431) (1,155)
Exchange rate differences − 398 398 − 168 168
Miscellaneous − (2) (2) − 4 4
Defined-benefit obligation at end of year 12,226 7,940 20,166 13,493 8,920 22,413
Present value of funded obligations at end of year 12,217 7,178 19,395 13,486 8,102 21,588
Present value of unfunded obligations at end of year 9 762 771 7 818 825
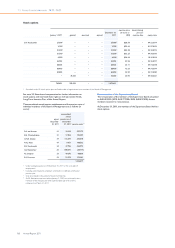
2010 2011
Netherlands other total Netherlands other total
Fair value of plan assets at beginning of year 13,329 5,141 18,470 13,606 6,474 20,080
Expected return on plan assets 743 344 1,087 713 389 1,102
Actuarial gains and (losses) on plan assets 95 625 720 155 483 638
Employee contributions − 3 3 − 3 3
Employer contributions 165 458 623 196 243 439
Acquisitions − − − − − −
Divestments − (1) (1) − − −
Settlements − (40) (40) − (51) (51)
Benefits paid (727) (370) (1,097) (724) (371) (1,095)
Exchange rate differences − 313 313 − 133 133
Miscellaneous 1 1 2 − − −
Fair value of plan assets at end of year 13,606 6,474 20,080 13,946 7,303 21,249
Funded status 1,380 (1,466) (86) 453 (1,617) (1,164)
Unrecognized prior-service cost − 6 6 − 5 5
Unrecognized net assets (1,389) (345) (1,734) (460) (399) (859)
Net balance sheet position (9) (1,805) (1,814) (7) (2,011) (2,018)
The classification of the net balance is as follows:
2010 2011
Netherlands other total Netherlands other total
Prepaid pension costs under other non-current assets − 14 14 − 5 5
Accrued pension costs under other liabilities − (1,057) (1,057) − (1,198) (1,198)
Provision for pensions under provisions (9) (762) (771) (7) (808) (815)
Liabilities directly associated with assets held for sale formely
reported as provision − − − − (10) (10)
(9) (1,805) (1,814) (7) (2,011) (2,018)