Philips 2011 Annual Report Download - page 122
Download and view the complete annual report
Please find page 122 of the 2011 Philips annual report below. You can navigate through the pages in the report by either clicking on the pages listed below, or by using the keyword search tool below to find specific information within the annual report.-
 1
1 -
2
-
3
-
4
-
5
-
6
-
7
-
8
-
9
-
10
-
11
-
12
-
13
-
14
-
15
-
16
-
17
-
18
-
19
-
20
-
21
-
22
-
23
-
24
-
25
-
26
-
27
-
28
-
29
-
30
-
31
-
32
-
33
-
34
-
35
-
36
-
37
-
38
-
39
-
40
-
41
-
42
-
43
-
44
-
45
-
46
-
47
-
48
-
49
-
50
-
51
-
52
-
53
-
54
-
55
-
56
-
57
-
58
-
59
-
60
-
61
-
62
-
63
-
64
-
65
-
66
-
67
-
68
-
69
-
70
-
71
-
72
-
73
-
74
-
75
-
76
-
77
-
78
-
79
-
80
-
81
-
82
-
83
-
84
-
85
-
86
-
87
-
88
-
89
-
90
-
91
-
92
-
93
-
94
-
95
-
96
-
97
-
98
-
99
-
100
-
101
-
102
-
103
-
104
-
105
-
106
-
107
-
108
-
109
-
110
-
111
-
 112
112 -
 113
113 -
 114
114 -
 115
115 -
 116
116 -
 117
117 -
 118
118 -
 119
119 -
 120
120 -
 121
121 -
 122
122 -
 123
123 -
 124
124 -
 125
125 -
 126
126 -
 127
127 -
 128
128 -
 129
129 -
 130
130 -
 131
131 -
 132
132 -
133
-
134
-
135
-
136
-
137
-
138
-
139
-
140
-
141
-
142
-
143
-
144
-
145
-
146
-
147
-
148
-
149
-
150
-
151
-
152
-
153
-
154
-
155
-
156
-
157
-
158
-
159
-
160
-
161
-
162
-
163
-
164
-
165
-
166
-
167
-
168
-
169
-
170
-
171
-
172
-
173
-
174
-
175
-
176
-
177
-
178
-
179
-
180
-
181
-
182
-
183
-
184
-
185
-
186
-
187
-
188
-
189
-
190
-
191
-
192
-
193
-
194
-
195
-
196
-
197
-
198
-
199
-
200
-
201
-
202
-
203
-
204
-
205
-
206
-
207
-
208
-
209
-
210
-
211
-
212
-
213
-
214
-
215
-
216
-
217
-
218
-
219
-
220
-
221
-
222
-
223
-
224
-
225
-
226
-
227
-
228
 |
 |

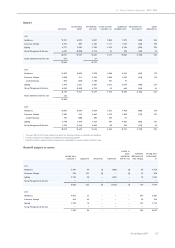
12 Group financial statements 12.6 - 12.6
122 Annual Report 2011
Equity and liabilities
2010 2011
Equity
Shareholders’ equity:
18
Preference shares, par value EUR 0.20 per share:
- Authorized: 2,000,000,000 shares (2010: 2,000,000,000 shares), issued none
Common shares, par value EUR 0.20 per share:
- Authorized: 2,000,000,000 shares (2010: 2,000,000,000 shares)
- Issued and fully paid: 1,008,975,445 shares (2010: 986,078,784 shares) 197 202
Capital in excess of par value 354 813
Retained earnings 15,416 12,917
Revaluation reserve 86 70
Other reserves 69 43
Treasury shares, at cost 82,880,543 shares (2010: 39,572,400 shares) (1,076) (1,690)
15,046 12,355
Non-controlling interests 46 34
Group equity 15,092 12,389
Non-current liabilities
Long-term debt
19 24 2,818 3,278
Long-term provisions
20 25 29 1,716 1,880
Deferred tax liabilities
3 171 77
Other non-current liabilities
21 1,714 1,999
Total non-current liabilities 6,419 7,234
Current liabilities
Short-term debt
19 24 1,840 582
Derivative financial liabilities
33 564 744
Income tax payable
3 291 191
Accounts and notes payable:
24 31
- Trade creditors 3,686 3,340
- Accounts payable to related parties 5 6
3,691 3,346
Accrued liabilities
22 2,995 3,026
Short-term provisions
20 25 29 623 759
Liabilities directly associated with assets held for sale
5 − 61
Other current liabilities
23 754 634
Total current liabilities 10,758 9,343
Contractual obligations and contingent liabilities
24 25
32,269 28,966
The accompanying notes are an integral part of these consolidated financial statements