Philips 2011 Annual Report Download - page 150
Download and view the complete annual report
Please find page 150 of the 2011 Philips annual report below. You can navigate through the pages in the report by either clicking on the pages listed below, or by using the keyword search tool below to find specific information within the annual report.-
 1
1 -
2
-
3
-
4
-
5
-
6
-
7
-
8
-
9
-
10
-
11
-
12
-
13
-
14
-
15
-
16
-
17
-
18
-
19
-
20
-
21
-
22
-
23
-
24
-
25
-
26
-
27
-
28
-
29
-
30
-
31
-
32
-
33
-
34
-
35
-
36
-
37
-
38
-
39
-
40
-
41
-
42
-
43
-
44
-
45
-
46
-
47
-
48
-
49
-
50
-
51
-
52
-
53
-
54
-
55
-
56
-
57
-
58
-
59
-
60
-
61
-
62
-
63
-
64
-
65
-
66
-
67
-
68
-
69
-
70
-
71
-
72
-
73
-
74
-
75
-
76
-
77
-
78
-
79
-
80
-
81
-
82
-
83
-
84
-
85
-
86
-
87
-
88
-
89
-
90
-
91
-
92
-
93
-
94
-
95
-
96
-
97
-
98
-
99
-
100
-
101
-
102
-
103
-
104
-
105
-
106
-
107
-
108
-
109
-
110
-
111
-
112
-
113
-
114
-
115
-
116
-
117
-
118
-
119
-
120
-
121
-
122
-
123
-
124
-
125
-
126
-
127
-
128
-
129
-
130
-
131
-
132
-
133
-
134
-
135
-
136
-
137
-
138
-
139
-
 140
140 -
 141
141 -
 142
142 -
 143
143 -
 144
144 -
 145
145 -
 146
146 -
 147
147 -
 148
148 -
 149
149 -
 150
150 -
 151
151 -
 152
152 -
 153
153 -
 154
154 -
 155
155 -
 156
156 -
 157
157 -
 158
158 -
 159
159 -
 160
160 -
161
-
162
-
163
-
164
-
165
-
166
-
167
-
168
-
169
-
170
-
171
-
172
-
173
-
174
-
175
-
176
-
177
-
178
-
179
-
180
-
181
-
182
-
183
-
184
-
185
-
186
-
187
-
188
-
189
-
190
-
191
-
192
-
193
-
194
-
195
-
196
-
197
-
198
-
199
-
200
-
201
-
202
-
203
-
204
-
205
-
206
-
207
-
208
-
209
-
210
-
211
-
212
-
213
-
214
-
215
-
216
-
217
-
218
-
219
-
220
-
221
-
222
-
223
-
224
-
225
-
226
-
227
-
228
 |
 |

11 12 13 14 15 12 Group financial statements 12.11 - 12.11
150 Annual Report 2011
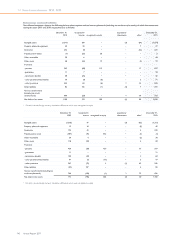
The estimated amortization expense for other intangible assets for each
of the next five years is:
2012 529
2013 372
2014 342
2015 318
2016 288
The expected useful lives of the intangible assets excluding goodwill are
as follows:
Brand names 2-20 years
Customer relationships 2-25 years
Technology 3-20 years
Other 1-8 years
Software 3 years
Development 3-5 years
The expected weighted average remaining life of other intangible assets
is 11.4 years as of December 31, 2011 (2010: 9.1 years).
The Group reviewed the useful lives of the intangible assets, resulting
in no material changes.
The unamortized costs of computer software to be sold, leased or
otherwise marketed amounted to EUR 91 million (2010: EUR 82
million). The amounts charged to the Consolidated statements of
income for amortization or impairment of these capitalized computer
software costs amounted to EUR 26 million (2010: EUR 25 million).
11 Non-current receivables
Non-current receivables include receivables with a remaining term of
more than one year, and the non-current portion of income taxes
receivable amounting to EUR 1 million (2010: EUR 2 million).
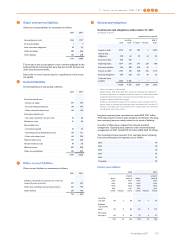
12 Other non-current financial assets
The changes during 2011 are as follows:
available-
for-sale
financial
assets
loans and
receivables
held-to-
maturity
invest-
ments
financial
assets
at fair value
through
profit or loss
total
Balance as of
January 1, 2011 362 53 2 62 479
Changes:
Reclassifications (4) 2 − 1 (1)
Acquisitions/
additions 30 26 − − 56
Sales/
redemptions/
reductions (96) (6) − (2) (104)
Impairment (34) − − − (34)
Value
adjustments (55) − − 6 (49)
Translation and
exchange
differences 1 (3) 1 − (1)
Balance as of
December 31,
2011 204 72 3 67 346
Available-for-sale financial assets
The Company’s investments in available-for-sale financial assets mainly
consist of investments in common stock of companies in various
industries.
On March 10, March 11 and March 30, 2011, Philips sold all shares of
common stock in TCL Corporation (TCL) to financial institutions in a
capital market transaction. This transaction represented 3.84% of
TCL’s issued share capital. The transaction resulted in a gain of EUR 44
million, reported under Financial income.
Impairment mainly relates to our 2.7% interest in TPV Technologies
Ltd. (TPV). At year-end the fair value based on the stock price of TPV
was EUR 25 million below the carrying value (fair value plus losses
recognized in accumulated other comprehensive income). As this loss
was considered significant and prolonged, an impairment charge of EUR
25 million was recorded by releasing the accumulated amounts under
Other comprehensive income to Financial expense.
Loans and receivables
The increase of loans and receivables in 2011 mainly related to the loan
given to Philips Sport Vereniging (PSV).
Financial assets at fair value through profit or loss
On September 7, 2010 Philips sold its entire holding of common shares
in NXP Semiconductors B.V. (NXP) to Philips Pension Trustees Limited
(herein after referred to as “UK Pension Fund”). As a result of this
transaction the UK Pension Fund obtained the full legal title and
ownership of the NXP shares, including the entitlement to any future
dividends and the proceeds from any sale of shares. From the date of
the transaction the NXP shares are an integral part of the plan assets
of the UK Pension Fund. The purchase agreement with the UK Pension
Fund includes an arrangement that may entitle Philips to a cash payment
from the UK Pension Fund on or after September 7, 2014, if the value of
the NXP shares has increased by this date to a level in excess of a
predetermined threshold, which at the time of the transaction was
substantially above the transaction price, and the UK Pension Fund is
in a surplus (on the regulatory funding basis) on September 7, 2014.
The arrangement qualifies as a financial instrument and is reported
under financial assets at fair value through profit and loss. The fair value
of the arrangement was estimated to be zero as of December 31, 2010.
As of December 31, 2011 management’s best estimate of the fair value
of the arrangement is EUR 8 million, based on the risks, the stock price
of NXP, the current progress and the long-term nature of the recovery
plan of the UK Pension Fund. The change in fair value until December
31, 2011 is reported under value adjustments in the table above and
also recognized in Financial income.
13 Other non-current assets
Other non-current assets in 2011 are comprised of prepaid pension
costs of EUR 5 million (2010: EUR 14 million) and prepaid expenses of
EUR 66 million (2010: EUR 61 million).
For further details see note 29, Pensions and other postretirement
benefits.
14 Inventories
Inventories are summarized as follows:
2010 2011
Raw materials and supplies 1,131 1,083
Work in process 510 630
Finished goods 2,224 1,912
3,865 3,625
The amounts recorded above are net of allowances for obsolescence.
In 2011, the write-down of inventories to net realizable value amounted
to EUR 239 million (2010: EUR 228 million). The write-down is included
in cost of sales.
15 Current financial assets
Other current financial assets were EUR nil million as at December 31,
2011 (2010: EUR 5 million). During 2010, two convertible bonds
previously issued to Philips by TPV Technology Limited and CBAY were
redeemed generating a total of EUR 239 million cash inflow and a fair
value loss of EUR 21 million was recognized in financial income and
expense, mainly related to these instruments.