Philips 2011 Annual Report Download - page 187
Download and view the complete annual report
Please find page 187 of the 2011 Philips annual report below. You can navigate through the pages in the report by either clicking on the pages listed below, or by using the keyword search tool below to find specific information within the annual report.-
 1
1 -
2
-
3
-
4
-
5
-
6
-
7
-
8
-
9
-
10
-
11
-
12
-
13
-
14
-
15
-
16
-
17
-
18
-
19
-
20
-
21
-
22
-
23
-
24
-
25
-
26
-
27
-
28
-
29
-
30
-
31
-
32
-
33
-
34
-
35
-
36
-
37
-
38
-
39
-
40
-
41
-
42
-
43
-
44
-
45
-
46
-
47
-
48
-
49
-
50
-
51
-
52
-
53
-
54
-
55
-
56
-
57
-
58
-
59
-
60
-
61
-
62
-
63
-
64
-
65
-
66
-
67
-
68
-
69
-
70
-
71
-
72
-
73
-
74
-
75
-
76
-
77
-
78
-
79
-
80
-
81
-
82
-
83
-
84
-
85
-
86
-
87
-
88
-
89
-
90
-
91
-
92
-
93
-
94
-
95
-
96
-
97
-
98
-
99
-
100
-
101
-
102
-
103
-
104
-
105
-
106
-
107
-
108
-
109
-
110
-
111
-
112
-
113
-
114
-
115
-
116
-
117
-
118
-
119
-
120
-
121
-
122
-
123
-
124
-
125
-
126
-
127
-
128
-
129
-
130
-
131
-
132
-
133
-
134
-
135
-
136
-
137
-
138
-
139
-
140
-
141
-
142
-
143
-
144
-
145
-
146
-
147
-
148
-
149
-
150
-
151
-
152
-
153
-
154
-
155
-
156
-
157
-
158
-
159
-
160
-
161
-
162
-
163
-
164
-
165
-
166
-
167
-
168
-
169
-
170
-
171
-
172
-
173
-
174
-
175
-
176
-
 177
177 -
 178
178 -
 179
179 -
 180
180 -
 181
181 -
 182
182 -
 183
183 -
 184
184 -
 185
185 -
 186
186 -
 187
187 -
 188
188 -
 189
189 -
 190
190 -
 191
191 -
 192
192 -
 193
193 -
 194
194 -
 195
195 -
 196
196 -
 197
197 -
198
-
199
-
200
-
201
-
202
-
203
-
204
-
205
-
206
-
207
-
208
-
209
-
210
-
211
-
212
-
213
-
214
-
215
-
216
-
217
-
218
-
219
-
220
-
221
-
222
-
223
-
224
-
225
-
226
-
227
-
228
 |
 |

14 Sustainability statements 14.2 - 14.2
Annual Report 2011 187
over 465 million lives, mainly through our Healthcare sector. Further
details on this parameter and the methodology can be found in the
document ‘Bringing care to people’.
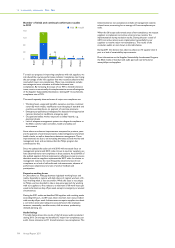
Energy Efficiency of Philips products
Energy efficiency is a key Green Focal Area for our Green Products.
Our analysis has shown that about 97% of the energy consumed during
the use phase of our products is attributable to Lighting products. The
remaining 3% is split over Consumer Lifestyle and Healthcare.
Therefore, we focus on the energy efficiency of our Lighting products
in the calculation. The annual energy consumption per product category
is calculated by multiplying the power consumption of a product by the
average annual operating hours and the annual pieces sold and then
dividing the light output (Lumen) by the energy consumed (Watt). The
average energy efficiency of our total product portfolio improved
slightly (some 2% in 2011 and 8% compared to 2009). Our LED sales
advanced well, but as demand for traditional lamps remained fairly
stable, the energy efficiency improvement of the total Lighting portfolio
was limited. Further details on this parameter and the methodology can
be found in the document ‘Energy efficiency of Philips products’.
Closing the materials loop
In 2010 we determined the 2009 baseline for global collection and
recycling amounts at around 37,000 tons (excluding TV), based on the
data retrieved from the WEEE collection schemes and from our own
recycling and refurbishment services (mainly Healthcare). The amount
of collection and recycling for 2010 was calculated at 35,000 tons as we
noticed a decrease in recycled Lighting products. Further details on this
parameter and the methodology can be found in the document
‘Collection and recycling’.
We determined the amount of recycled materials in our products in
2011 at some 10,000 tons, by focusing on the material streams plastics,
aluminum and refurbished products, depending on the relevance in each
sector. Further details on this parameter and the methodology can be
found in the document ‘Recycled materials’.
Green Product sales
Sales from Green Products grew in 2011 to EUR 8,805 million. Green
Product sales increased 9% from EUR 8,069 million.
Green Product sales
in millions of euros unless otherwise stated
2009 2010 2011
Philips Group 6,163 8,069 8,805
as a % of total sales 31 36 39
All sectors contributed to the growth in Green Product sales.
Healthcare achieved the highest Green Product nominal sales growth
(25%), followed by Lighting (4%) and Consumer Lifestyle (1%). Lighting
introduced over 4,000 new Green Products in 2011, Consumer
Lifestyle over 200 and Healthcare 29.
Green Product sales per sector
as a % of Group sales
2009 2010 2011
Healthcare 23 25 30
Consumer Lifestyle 18 27 27
Lighting 52 58 60
Philips Group 31 36 39
The Philips EcoDesign process aims to create products that have
significantly less impact on the environment during their whole lifecycle.
Overall, the most significant improvements have been predominantly
realized in our energy efficiency Green Focal Area.
New Green Products from each sector include the following examples.
Healthcare
During 2011, we added 29 green products to our Green Product
portfolio – for the hospital, the home and points in-between – which
brought us closer to our goal of touching 500 million lives, while
reducing the environmental impact of our products. All Business
Groups in the sector contributed to the increase. The BG Imaging
Systems launched the 3T Ingenia Magnetic Resonance systems with
digital dStream architecture, which uses up to 24% less energy and 24%
less weight in materials versus its reference product. Innovations by the
BG PCCI include the IntelliVue MX40 Patient Monitor, a wearable
patient monitor that can be used for the monitoring of ambulatory
patients and during patient transport. Next to the clinical benefits it
also offers a 85% reduction in power usage, as well as achieving product
and packaging weigh reductiont. Another example is the Home
Healthcare Solutions Trilogy that uses 62% less energy than its
predecessor, as well as achieving 72% weight reduction and 49%
packaging weight reduction.
Consumer Lifestyle
Energy management has always been a strong focus in the Consumer
Lifestyle sector as well as the avoidance of substances of concern in our
products, in addition to our efforts to close the materials loop. Philips
continued with the introduction of products free of polyvinyl chloride
(PVC) and brominated flame retardants (BFR), like the PowerTouch
and AquaTouch Shaver ranges, and Electric Steam Sterilizers.
Lighting
Philips is proud to be the provider of the LED headlighting source in
Nissan’s zero emission electrical vehicle, the Nissan Leaf. Our
LUXEON Altilon features the industry’s lowest power consumption
headlamp and the Nissan Leaf is a first of a kind family size car which
applies LED headlighting as standard lighting technology in the base
model.
Philips’ new StyliD Performance and LuxSpace Accent solutions are
revolutionizing accent lighting solutions for supermarkets and fashion
retailers, exceeding the performance of cHID high flux lamps. With
extremely high light flux and long system lifetime, these are the only
LED accent lighting solutions on the market that are able to deliver high
light quality (CRI90) with three well-defined beams that create the
perfect balance between the accent effect and the surrounding
environment. Furthermore, LED accent lighting solutions omit less heat
and UV, ensuring longevity of products such as leather clothes and
cosmetics which perish faster under conventional lighting. Philips’ StyliD
Performance and LuxSpace Accent lighting solutions thus both reduce
heat output and provide the best quality white light which is highly
efficient.
The Philips eye-catching Ledino range provides a new light experience
in an energy efficient way. With its long lifetime it saves up to 80%
energy versus traditional light sources. The Luxeon LEDs inside provide
a clear and warm light which can be dimmed in order to achieve light
delicately, creating the preferred atmosphere.
Green Innovation
In 2011, Philips invested EUR 479 million in Green Innovation – the
R&D spend related to the development of new generations of Green
Products and Green Technologies. We intend to invest a cumulative
EUR 2 billion over the coming five years.
Green Innovation per sector
in millions of euros
2009 2010 2011
Healthcare 50 60 85
Consumer Lifestyle 68 56 67
Lighting 185 230 291
Corporate Technologies 44 46 36
Philips Group 347 392 479
Healthcare
Philips Healthcare innovation projects are targeted at making a
difference wherever care is provided - in the hospital, the home and
points in-between. The investments in Green Innovation amounted to
some EUR 85 million, concentrating on innovation projects that that
take into account all of the Green Focal Areas and aim to reduce total
life cycle impact. In particular the sector focuses on reducing energy
consumption, weight and radiation dosage. Healthcare is also reducing
amounts of environmentally relevant substances in order to prepare
for substance legislation such as RoHS and REACH.